Columbus forecast 2022

Assistant Professor of Management, Indiana University Division of Business, IUPUC

Assistant Professor of Management, Indiana University Division of Business, IUPUC
The Columbus metropolitan statistical area (MSA) is primarily a manufacturing-based economy linked to the transportation industry and light vehicle manufacturing. It has experienced a significant negative economic impact due to COVID-19. With the continuing pandemic, a challenging year for transportation-related durable goods and fewer light vehicle sales in North America, Columbus concluded 2020 with higher unemployment than 2019 and is projected with a lower GDP. Current expectations are for the local economy to increase slightly during 2021 in light of mixed economic indicators. This article explores these data, as well as what is anticipated for 2022.
Key measures
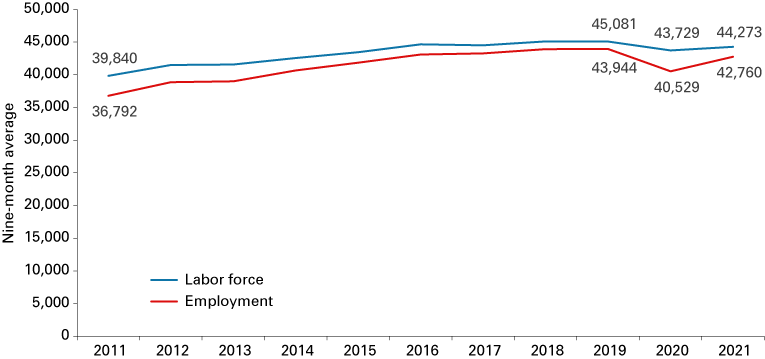
Employment and labor force: From 2010 to 2019, the Columbus MSA experienced increases in annual average labor force and job growth, with average annual job growth between 68 and 2,300—resulting in a total increase of 9,100 jobs. However, employment declined by 3,000 jobs in 2020, followed by a 1,800 increase in the first nine months of 2021, based on the Local Area Unemployment Statistics (LAUS) data set from the U.S. Bureau of Labor Statistics (BLS).
Figure 1 shows labor force and employment for the region. Note: Labor supply pressures are expected to continue due to retirements, slow population growth and new employers entering markets in surrounding counties.
Figure 1: Labor force and nonfarm jobs
Note: Data are January-September averages and are not seasonally adjusted.
Source: Local Area Unemployment Statistics, U.S. Bureau of Labor Statistics
Unemployment: The pandemic lockdown spiked unemployment in the U.S., Indiana and Columbus in April 2020 to double digits. As the nation slowly recovered from the economic disruption, the unemployment rate for the U.S. declined to 4.6% in September 2021. Indiana’s unemployment rate for September 2021 (not seasonally adjusted) was 3.5%. Columbus’ September 2021 unemployment rate was 2.7% (not seasonally adjusted) after peaking at 17.5% in April 2020.1 The Columbus MSA unemployment rate is slightly lower than any of the counties contiguous to Bartholomew, reflecting the solid employment base in this county.
Table 1, which shows selected Indiana metros and micros, highlights that the local unemployment rates remain lower than the national and state averages in the aftermath of the pandemic shutdown.
Table 1: September unemployment rate comparison for selected Indiana metros and micros
| 2013 | 2014 | 2015 | 2016 | 2017 | 2018 | 2019 | 2020 | 2021 | |
|---|---|---|---|---|---|---|---|---|---|
| U.S. | 7.0% | 5.7% | 4.9% | 4.8% | 4.1% | 3.6% | 3.3% | 7.7% | 4.6% |
| Indiana | 6.8% | 5.3% | 4.2% | 4.0% | 3.2% | 3.0% | 2.8% | 6.0% | 3.5% |
| Bloomington | 6.2% | 5.3% | 4.2% | 4.1% | 3.2% | 3.0% | 2.6% | 4.8% | 2.8% |
| Cincinnati* | 6.0% | 4.8% | 3.7% | 3.3% | 2.6% | 2.6% | 2.4% | 4.7% | 2.7% |
| Columbus | 5.1% | 3.9% | 3.1% | 3.0% | 2.4% | 2.2% | 2.0% | 5.0% | 2.7% |
| Evansville* | 6.2% | 4.8% | 3.7% | 3.8% | 2.8% | 2.7% | 2.6% | 5.6% | 3.4% |
| Greensburg | 7.5% | 5.8% | 4.5% | 4.2% | 3.6% | 3.2% | 3.0% | 5.4% | 3.0% |
| Indy-Carmel-Anderson | 6.5% | 5.2% | 3.9% | 3.7% | 3.1% | 2.9% | 2.6% | 6.2% | 3.4% |
| Kokomo | 7.0% | 5.6% | 4.3% | 3.9% | 3.3% | 3.2% | 3.2% | 7.9% | 6.7% |
| Louisville* | 6.2% | 5.0% | 4.0% | 3.9% | 3.2% | 3.1% | 2.8% | 5.7% | 3.0% |
| North Vernon | 7.8% | 5.7% | 4.1% | 4.1% | 3.2% | 3.0% | 2.4% | 5.2% | 3.5% |
| Seymour | 5.7% | 4.5% | 3.5% | 3.3% | 2.8% | 2.6% | 2.2% | 4.8% | 2.9% |
* Only the Indiana portion of the metro is included.
Note: Data are not seasonally adjusted. Red cells indicate the highest rate and green cells indicate the lowest rate for each year.
Source: STATS Indiana, using Local Area Unemployment Statistics data from the U.S. Bureau of Labor Statistics
Statistics
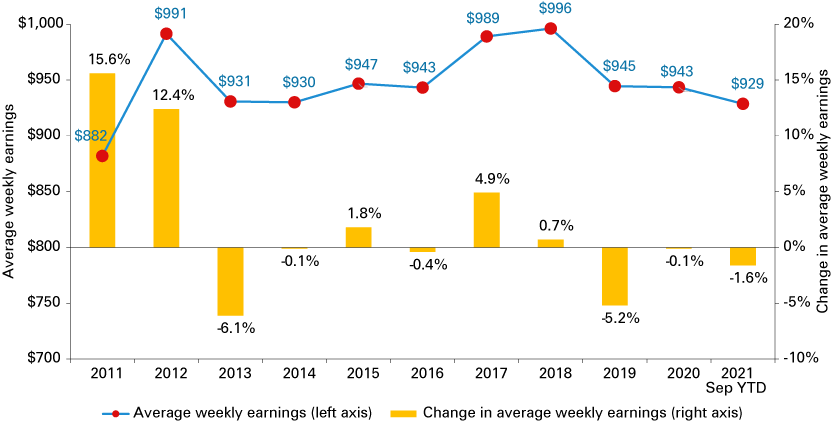
Weekly earnings: Average weekly earnings for the Columbus MSA experienced an impressive 36% growth from a low of $730 in 2009 to $996 in 2018.2 However, 2019 reflected a 5.2% decline in weekly earnings from 2018 followed by a 0.1% decline in 2020. The average for the first nine months of 2021 reflects a 1.6% decline from the 2020 average annual weekly earnings. Figure 2 shows the average weekly earnings data since 2011.
Figure 2: Total private average weekly earnings in the Columbus MSA
Note: Data are not seasonally adjusted.
Source: Current Employment Statistics, U.S. Bureau of Labor Statistics and Indiana Department of Workforce Development
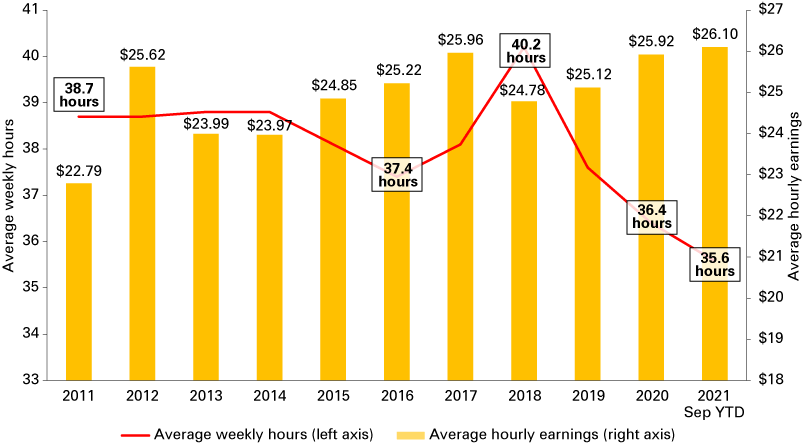
Average weekly hours remained relatively flat around 38.7 hours per week from 2010 until 2014 then declined in both 2015 and 2016 in conjunction with the declining GDP in 2014, 2015 and 2016. As GDP increased following the 2016 decline, average hours per week increased to the highest level in over 10 years—40.2 hours per week in 2018—before declining to 37.6 hours per week in 2019 and 36.4 hours per week in 2020. The decline in average hours per week continued into the first nine months of 2021 to 35.6 hours (see Figure 3).
Figure 3: Total private average weekly hours and average hourly earnings in the Columbus MSA
Note: Data are not seasonally adjusted.
Source: Current Employment Statistics, U.S. Bureau of Labor Statistics and Indiana Department of Workforce Development
The rate of growth for average hourly earnings has changed from 3.7% in 2015 to -4.5% in 2018, followed by increases in 2019 and 2020.3 Average hourly earnings have increased in 2021 with September 2021 (year to date) reflecting a 1.6% increase from September 2020 (year to date). This may reflect the wage pressures due to the current labor shortages.
Economic indicators
Light vehicle sales in the U.S. declined in 2019 by approximately 1%, followed by a 15% decline in 2020.4 This trend can be seen in Figure 4. Of more importance to the Columbus area, new vehicle production in the U.S. for the first nine months of each year declined from a high of 3.3 million vehicles in 2013 to 1.4 million units in 2020 and 1.2 million units in 2021.5 While full-year production is expected to rebound in both 2021 and 2022 to replenish the low inventory levels (in addition to fulfilling ongoing demand), as can be seen in Figure 5, supply chain issues will continue to be a headwind for the automotive industry.
Figure 4: Total annual U.S. new vehicle unit sales

Note: Data are not seasonally adjusted.
Source: U.S. Bureau of Economic Analysis, Total Vehicle Sales [TOTALNSA], retrieved from FRED, Federal Reserve Bank of St. Louis, https://fred.stlouisfed.org/series/TOTALNSA
Figure 5: U.S. monthly vehicle production, inventory and inventory/sales ratio
Supply chain issues: Since early 2020, Americans have become acutely aware of supply chain disruptions. The first major product shortages were of toilet paper, hand sanitizer and cleaning supplies. Most of these shortages were attributed to a sudden and dramatic increase in demand at the onset of the COVID-19 pandemic that quickly depleted retailers and distributors of their inventory of these products. Nearly two years later, we see a much wider range of product shortages from construction material and household goods to consumer electronics, toys, clothing and food products. Many shortages today have less to do with sudden, dramatic increases in demand and more to do with the transportation of raw material, components and finished goods through the supply chain.
A common model of a supply chain involves a consumer buying a product from a retailer, who purchased the product from a distributor, who purchased it from a manufacturer, who purchased parts for the product from multiple suppliers, each of whom in turn purchased raw materials from their suppliers. Supply chain disruptions are not new, but in the past, they have usually been caused by a problem within one of the entities listed above. But what we are currently experiencing is, in many cases, a disruption between the entities of the supply chain.
Attention has been paid recently to the growing number of ships waiting to be unloaded in Southern California. As of October 20, there were 80 container ships carrying $25 billion worth of cargo waiting to be unloaded.6 These figures do not include ships waiting to be unloaded in Washington, Oregon or anywhere on the East Coast. This cargo is a mix of raw materials and components destined for American manufacturers, as well as finished goods destined for distribution centers and retailers. The delays in getting the ships unloaded are contributing to empty shelves in stores, along with factories shutting down (or running below capacity) due to parts shortages.
One of the biggest bottlenecks at the ports is the lack of trucks and truck drivers to pick up the cargo containers from the stockyard. According to the American Trucking Association’s Chief Economist, Bob Costello, the United States currently needs 80,000 more truck drivers than are currently in the workforce.7 While the shortage was made worse due to accelerated retirements during the pandemic, the driver shortage problem has been listed as the number one issue facing the trucking industry for five consecutive years.8
The current driver shorter may get significantly worse in the coming weeks due to COVID-19 vaccine mandates. A recent survey of truck drivers, conducted by Trucker News, found that only 32% of respondents reported that they had been vaccinated or would comply with a mandate; 46% said they would refuse the vaccination and either quit or be fired; and an additional 17% said they would seek a medical or religious exemption.9
While there are no “simple solutions” to today’s problems, several ideas have been proposed but none are without controversy. For instance, the CATO Institute has proposed easing regulations to make it easier for trucks and truck drivers from Mexico to operate in the United States at least for the next six to 12 months to help ease the supply chain crisis.10 Another idea involves the U.S. military loaning military-owned cargo containers and truck carriages to the private sector. Other ideas have been proposed to ease restrictions on the number of hours truck drivers can drive in a given day. The common denominator among all of these ideas is that they each offer some level of easing of our current problem, but they come at the potential price of increased risk of accidents or impaired military readiness.
The key takeaway from today’s supply chain woes is that the problems did not develop overnight and will not be solved overnight.
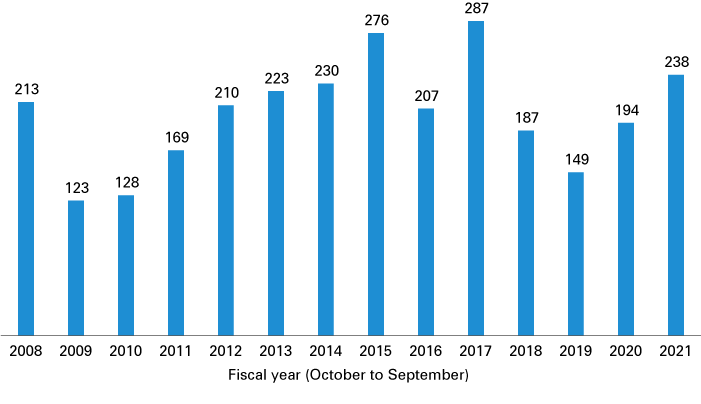
Local building permits: Following a strong fiscal year 2017 for building permits in Columbus (287 permits), residential building permits declined in fiscal years 2018 and 2019 before recovering in 2020 with an increase of 30% in 2020 and an additional 23% in 2021 (see Figure 6). The fiscal year 2021 data reflects a return to a more normal level in the October-December time frame with a substantial increase in the January-September time period (195). Because the building permits growth rate is a leading indicator of economic activity, the increase in building permits in 2020 and 2021 may constitute a good omen for the Columbus MSA going forward as more potential employees can obtain housing.
Figure 6: Local fiscal year building permit trends for the Columbus MSA
Source: U.S. Census Bureau
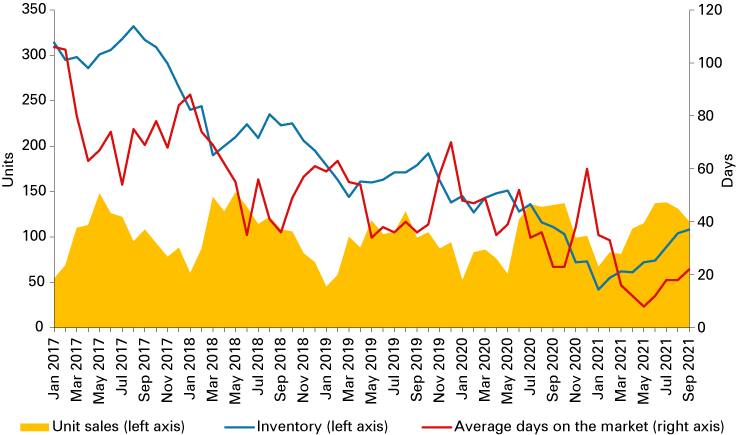
Residential housing sales: Residential sales declined from a high of 1,045 units for the first nine months of 2018 to 844 units in 2019 and 879 units in 2020, before increasing by almost 100 units in the first nine months of 2021 to reach 978 sales units. Also evident is the significant decline in inventory and days on the market (see Figure 7). Inventory of unsold homes declined to 42 units in January 2021 before rebounding to 108 units in September. Days on the market declined to just eight days in May before rebounding to 22 days in September 2021. Also noteworthy, the average median price has increased from $172,000 in 2017 to $223,000 in 2021, a 30% increase over the four-year period.
Figure 7: Columbus MSA real estate sales, inventory and average days on the market
Note: Data are shown through September 2021.
Source: Metropolitan Indianapolis Board of Realtors, National Association of Realtors and Indiana Association of Realtors
Commercial real estate: Commercial real estate (including multifamily units, industrial, retail and office units) in the Columbus MSA performed relatively well through the pandemic period. Vacancy rates are at or below historical levels and rents/asking prices reflect modest increases approximately equal to inflation. New multifamily units and mixed-use projects are underway as sentiment is high following strong activity in 2020 and a normal level of activity in 2021. Surprisingly, retail space vacancy rates will continue below historical levels with rent increases below 2%; industrial vacancy rates will also continue below historical levels, excluding specialty industrial space.
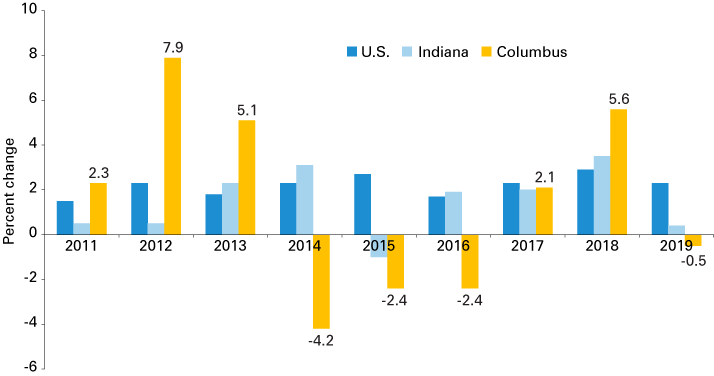
Local real GDP growth: From 2011 to 2019, Columbus’ chained GDP has increased by an average of 1.5% per year. This period includes the declines in GDP for Columbus in 2014, 2015 and 2016, where the local economy contracted due to slowing in transportation/automotive-related manufacturing. Chained GDP for Columbus also decreased by 0.5% in 2019 (see Figure 8), the year before the pandemic.
Figure 8: Year-over-year chained GDP growth
Source: U.S. Bureau of Economic Analysis (chained GDP)
Following the declines from 2014-2016, the average rate of GDP growth in Columbus has increased in two of the past three years of available data, with a three-year average growth rate comparable to the nation and several other Indiana metros—including Bloomington and Indianapolis (see Table 2). Columbus’ GDP fluctuations reflect the cyclical nature of a manufacturing/durable goods–based economy.
Table 2: Annual GDP growth rate comparison for selected metros
| 2014 | 2015 | 2016 | 2017 | 2018 | 2019 | 3-year average |
|
|---|---|---|---|---|---|---|---|
| U.S. | 2.3 | 2.7 | 1.7 | 2.3 | 2.9 | 2.3 | 2.5 |
| Indiana | 3.1 | -1.0 | 1.9 | 2.0 | 3.5 | 0.4 | 2.0 |
| Bloomington, IN | 4.9 | -0.5 | 2.3 | 4.1 | 2.9 | 0.4 | 2.5 |
| Cincinnati, OH | 2.7 | 2.7 | 3.4 | 1.8 | 2.6 | 3.0 | 2.5 |
| Columbus, IN | -4.2 | -2.4 | -2.4 | 2.1 | 5.6 | -0.5 | 2.4 |
| Evansville, IN | -1.4 | 0.8 | 1.1 | 5.9 | 2.6 | 5.0 | 4.5 |
| Indianapolis-Carmel-Anderson, IN | 2.3 | -2.5 | 1.8 | 1.3 | 3.6 | 2.2 | 2.4 |
| Kokomo, IN | -3.7 | -6.8 | -2.7 | -2.7 | 1.8 | 2.2 | 0.4 |
| Louisville, KY | 1.1 | 2.8 | 2.3 | -0.2 | 1.7 | 1.6 | 1.0 |
Note: Shaded cells indicate declines.
Source: U.S. Bureau of Economic Analysis (chained GDP)
Outlook
Upside potential
-
U.S. light vehicle sales are forecast to recover in 2021 to around 15.8 million vehicles and continue to grow to 16.9 million vehicles in 2022.11 North American production is expected to remain flat at 13.0 million units in 2021, then increase to 15.2 million units in 2022 (a 17% increase).12
New orders for manufactured durable goods increased in 10 of the past 12 months, with the only declines in April and September of 2021.13
Cummins’ revenues are forecast to increase by 20% in 2021, followed by an 8% increase in 2022.14 This strong revenue growth corresponds with increased new vehicle sales and a return to capital investments in transportation-related industries.
- Residential housing sales and building permits will continue to rebound in 2021 and 2022.
Downside potential
U.S. light vehicle production may be constrained in 2021 and 2022 by supply chain issues.15
Continuing the sentiment from the previous forecasts, Columbus continues to have a high rate of labor force participation (67%), relatively low unemployment and competitive weekly earnings. GDP growth may be hindered by the lack of population growth and the number of unfilled jobs.
Forecast
Columbus is expected to experience positive real GDP growth for 2022 of 5.0%-6.0% based on recovery in new vehicle sales and strength in durable goods, with performance strongest in the second half of the year. Risks exist that might lead to weaker results. Continued supply chain challenges, uncertainty in the nation’s capital, trade uncertainty, tightening of business investment and a further tightening of the local labor market may challenge GDP growth. Yet, local wage recovery should support the consumer segment of GDP.
Unemployment is expected to decrease slightly to 2.4%-2.8% in 2022, with new participants entering a tight job market as supply chain issues begin to diminish in the second half of 2022. This will be complicated by continued challenges for the hospitality industry in the first half of 2022 as the pandemic continues into the early part of the year.
The pandemic remains an extraordinary event in the U.S. economy. How the U.S. continues to cope with this health-related shock, the related supply chain issues and the nation’s political uncertainty remain as dynamic variables within the presented projections.
Notes
- U.S. Bureau of Labor Statistics data retrieved October 29, 2021, from www.stats.indiana.edu/laus/laus_view3.html
- Source: STATS Indiana, using U.S. Bureau of Labor Statistics and Indiana Department of Workforce Development data
- Employment, hours & earnings (CES). (2021). STATS Indiana. Retrieved October 18, 2021, from www.stats.indiana.edu/ces/ces_naics/
- U.S. Bureau of Economic Analysis, Total Vehicle Sales [TOTALNSA], retrieved October 18, 2021, from FRED, Federal Reserve Bank of St. Louis, https://fred.stlouisfed.org/series/TOTALNSA
- U.S. Bureau of Economic Analysis, Domestic Auto Production [DAUPSA], retrieved October 18, 2021, from FRED, Federal Reserve Bank of St. Louis, https://fred.stlouisfed.org/series/DAUPSA
- Miller, G. (2021, October 20). $25b worth of cargo stuck on 80 container ships off California. FreightWaves. www.freightwaves.com/news/22b-worth-of-cargo-is-now-stuck-on-container-ships-off-california
- Cannon, J. (2021, October 25). Economist says trucking short 80,000 drivers. Commercial Carrier Journal. www.ccjdigital.com/workforce/article/15280400/truck-driver-shortage-estimate-grows
- American Transportation Research Institute. (2021, October). Critical issues in the trucking industry – 2021. https://truckingresearch.org/wp-content/uploads/2021/10/ATRI-Top-Industry-Issues-2021.pdf
- Quimby, T., & Cannon, J. (2021, August 2). Majority of drivers say they would resist vaccine, COVID testing requirements from fleets. Commercial Carrier Journal. www.ccjdigital.com/workforce/health-wellness/article/15066786/mandated-vaccines-in-trucking-may-lead-to-employee-recruitment-woes
- Lincicome, S. (2021, October 20). More bad policies contributing to the “supply chain crisis.” CATO Institute. www.cato.org/blog/more-bad-policies-contributing-supply-chain-crisis
- Alliance for Automotive Innovation. (2021, September 22). Reading the meter: A look inside a cleaner, safer, smarter auto industry. www.autosinnovate.org/readingthemeter .
- Flowers, D. (2021, October 18). Worsening run rate, but 2022 global light vehicle production outlook intact. IHS Markit. https://ihsmarkit.com/research-analysis/2022-global-light-vehicle-production-outlook.html
- U.S. Census Bureau. (2021, October 27). Monthly advance report on durable goods manufacturers’ shipments, inventories and orders. www.census.gov/manufacturing/m3/adv/pdf/durgd.pdf
- Cummins, Inc. (CMI). Yahoo! Finance. Retrieved October 25, 2021, from https://ca.finance.yahoo.com/quote/CMI/analysis?p=CMI
- See note 12.


