

Census results show Indiana’s growing diversity
Senior Demographer, Indiana Business Research Center, Indiana University Kelley School of Business
The latest data release from the 2020 Census shows that Indiana’s population continues to become more diverse. In fact, one-quarter of Hoosiers identified as part of a minority race or ethnic group in 2020, up from nearly 19% a decade earlier. Indiana is also becoming more diverse from the ground up, as the state’s population under the age of 18 is far more diverse than the adult population.
Before diving into the numbers, it is important to highlight that the U.S. Census Bureau made some significant changes to the way it collected and processed responses on racial and ethnic identity in 2020. According to the bureau, these improvements provide a much better picture of the true racial and ethnic makeup of our population.1 However, these changes also mean that the 2020 population counts by race and ethnicity are not directly comparable to those from previous censuses, and such comparisons can be misleading without proper context.
That said, the pull to make these comparisons anyway is just too strong. So, when looking at changes over time, it’s best to view these shifts as revealing two stories at once: that Indiana continues to grow more diverse, and that the state has long been more diverse than we previously understood. Unfortunately, there is no way to know how much of the shift in any race or ethnic group represents true demographic change and how much is a product of data collection and processing improvements.
Indiana’s growing diversity
Among Indiana’s largest race and ethnic groups, the largest shifts over the decade were seen in residents who identify as either multi-race or white.2 As Figure 1 shows, the number of Hoosiers who identified as being multiracial increased by 165,979 residents between 2010 and 2020—a 167% increase. Meanwhile, the number of residents identifying as white declined by 165,449 (-3.1% difference) between the censuses. Although it is not possible to know for certain, the Census Bureau’s methodological changes likely had their largest impacts on the shifts seen in these two groups.
With an increase of 164,484 residents over the decade (a 42.2% difference), the state’s Hispanic population posted the second-largest gain, while the number of Hoosiers who are Asian and Black increased by 65,207 (64.3%) and 55,360 (9.5%), respectively.
Figure 1: Difference in Indiana population by race and ethnic group, 2010 to 2020
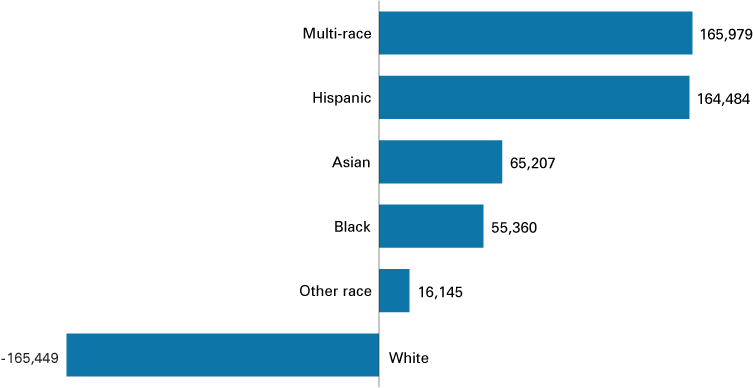
Note: Hispanic refers to an ethnicity, not a race. Hispanic residents can be of any race. All race categories refer to non-Hispanic residents of those races.
Source: U.S. Census Bureau
Looking at total population counts by race and ethnic group, the majority of Indiana’s 6.8 million residents are white (5.12 million), followed by Black (637,500), Hispanic (554,191), multi-race (265,344), Asian (166,651), American Indian or Alaska Native (12,938), and Native Hawaiian or other Pacific Islander (2,761). An additional 25,139 Hoosiers identified as being of some other race.
Even with these dramatic shifts, Indiana remains much less diverse than the nation. In 2020, slightly more than three-quarters of Hoosiers identified as white compared to roughly 58% of all Americans (see Figure 2). Meanwhile, relative to the U.S., much smaller shares of Indiana’s population are Black, Hispanic and Asian.
Figure 2: Share of Population in 2020 by Race and Ethnic Group, Indiana and U.S.
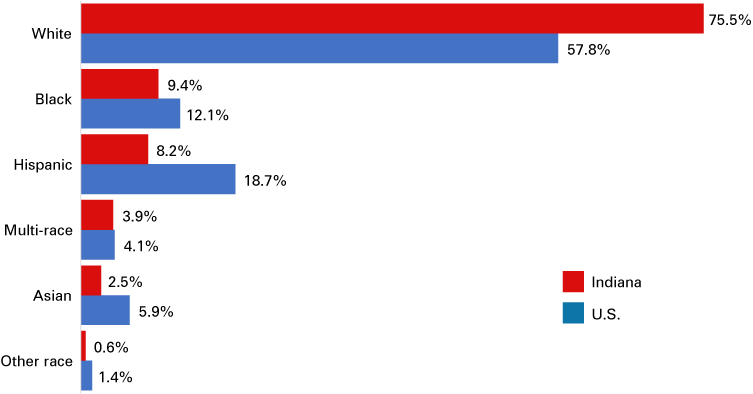
Note: Hispanic refers to an ethnicity, not a race. Hispanic residents can be of any race. All race categories refer to non-Hispanic residents of those races.
Source: U.S. Census Bureau
Greater diversity among young Hoosiers
The growing diversity of the Indiana population is most evident among the state’s younger residents. More than one-third of the state’s population under the age of 18 identified as part of a minority group in 2020 compared to just 22% of the adult population (see Figure 3). For the multi-race and Hispanic groups, their shares of Indiana’s youth population are both roughly twice as large as their shares of the adult segment.
Figure 3: Share of Indiana population in 2020 by race, ethnicity and age group
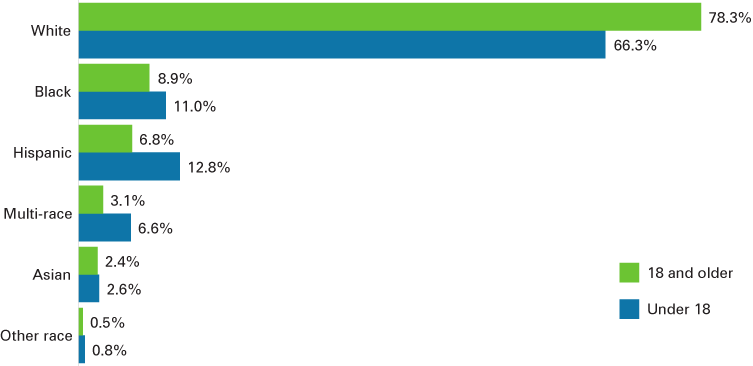
Note: Hispanic refers to an ethnicity, not a race. Hispanic residents can be of any race. All race categories refer to non-Hispanic residents of those races.
Source: U.S. Census Bureau
A different perspective on this trend is that 40% of the state’s multi-race population is under the age of 18, while 37% of Hispanic residents are under this mark (see Figure 4). By contrast, 23% of the state’s total population is younger than 18. Given the comparative youth of many minority groups in the state, Indiana’s trend toward growing diversity is certain to continue in the decades ahead.
Figure 4: Indiana’s share of population that is younger than 18 by race and ethnic group, 2020
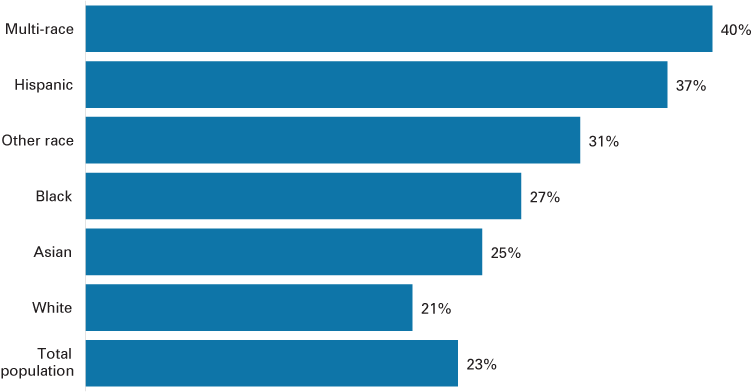
Note: Hispanic refers to an ethnicity, not a race. Hispanic residents can be of any race. All race categories refer to non-Hispanic residents of those races.
Source: U.S. Census Bureau
Local demographic shifts
Increasing diversity extends to every corner of the state, as each of Indiana’s 92 counties saw its share of minority residents increase over the decade. Driven largely by a 159% growth in its Hispanic population, Jackson County (Seymour) had the largest increase in the share of its total population that were minorities. In 2010, minority groups accounted for 8.4% of Jackson County’s total, but this share jumped to 18.6% in 2020. Tippecanoe (Lafayette), Marion (Indianapolis), Hendricks (Plainfield) and Bartholomew (Columbus) counties each saw this measure increase by more than 8 percentage points over the same period.
Booming suburban communities, in particular, are growing more diverse at a relatively fast pace. Hendricks, Johnson, Boone and Hamilton counties in the Indianapolis metro area, along with Porter County in Northwest Indiana, are among the 12 counties with the largest percentage point increases in the minority share of their populations. Parke County (Rockville) had the state’s smallest uptick in this measure at 0.5 percentage points (see Figure 5).
Figure 5: Percentage point change in minority share of county population, 2010 to 2020
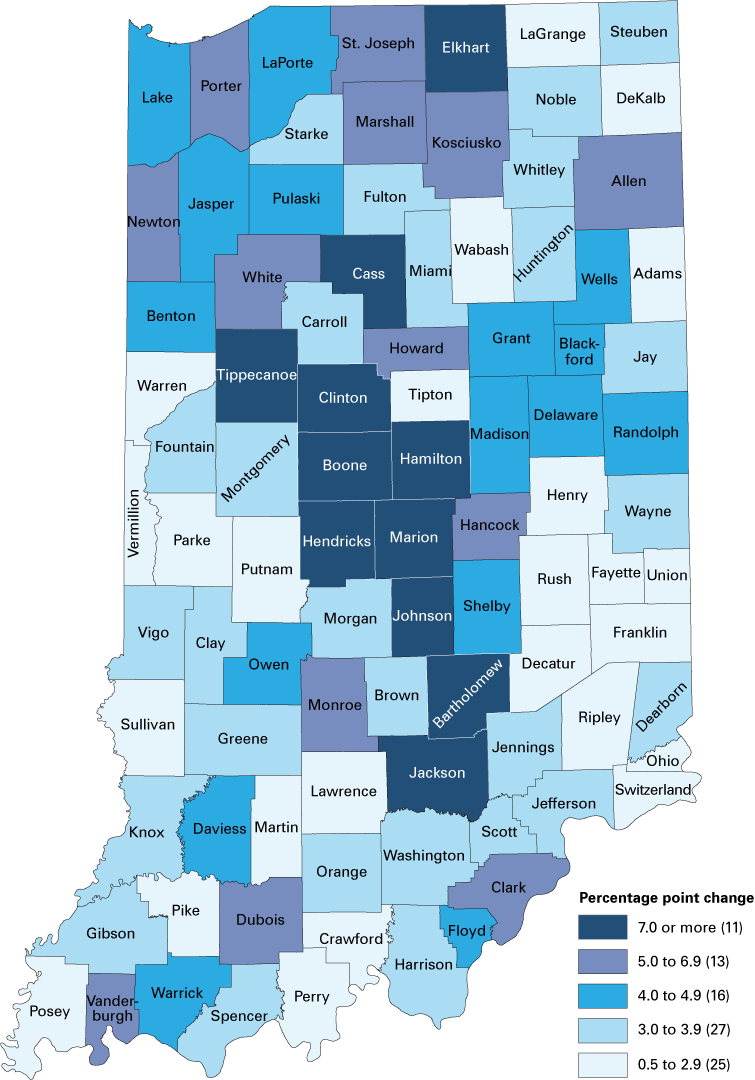
Source: U.S. Census Bureau
Marion and Lake counties remained Indiana’s most diverse communities in 2020 (see Figure 6). White residents account for 50.5% of Marion County’s population and a nearly identical 50.4% of Lake County’s total. Black residents are the second-largest race or ethnic group in both locales—claiming 27.2% of the total in Marion County and 24.3% in Lake County. Meanwhile, Hispanic residents accounted for one-fifth of the Lake County total and 13.2% of Marion County’s residents.
As the state’s most-populous counties, these two together account for nearly 22% of Indiana’s total population, yet roughly 61% of all Black Hoosiers reside in either Marion or Lake counties, along with more than 41% of the state’s Hispanic residents.
St. Joseph, Elkhart, Allen and Tippecanoe counties are the only other counties to have a minority share of total population that is greater than the Indiana mark of 24.5%.
Figure 6: Minority share of total county population, 2020
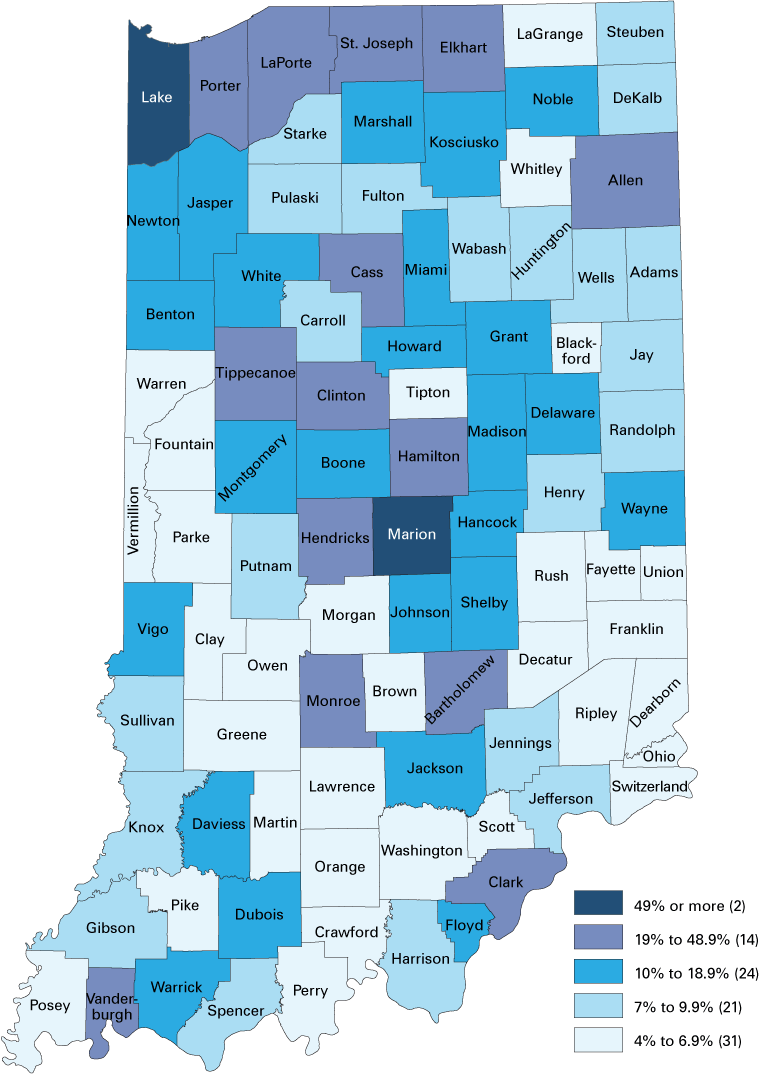
Source: U.S. Census Bureau
As is the case statewide, nearly all counties have greater diversity in their younger age groups. Figure 7 shows the 10 counties with the greatest diversity in the population under the age of 18, as well as the minority share of the adult population in those communities. In Marion and Lake counties, more than 60% of the population under the age of 18 identified as part of a minority group.
Figure 7: Minority share of population in 2020 by age group, top 10 counties
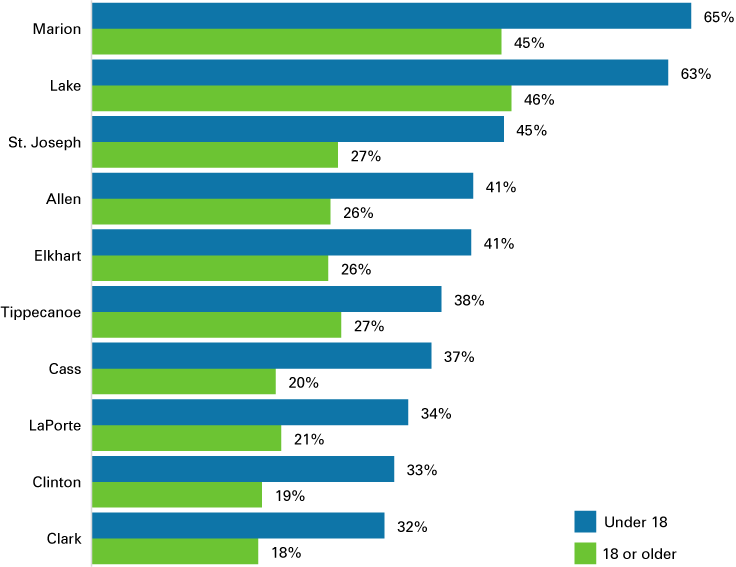
Source: U.S. Census Bureau
Learn more
The purpose of this release from the Census Bureau is to provide Indiana officials with the data needed to redraw congressional and legislative districts. These data at various levels of geography can be found at www.stats.indiana.edu. More data from the Census Bureau with additional age, sex, race and ethnicity details will be released at a later date.
Notes
- N. Jones, R. Marks, R. Ramirez, and M. Rios-Vargas, “Improved race and ethnicity measures reveal U.S. population is much more multiracial,” U.S. Census Bureau: America Counts: Stories Behind the Numbers, August 12, 2021, www.census.gov/library/stories/2021/08/improved-race-ethnicity-measures-reveal-united-states-population-much-more-multiracial.html.
- Hispanic refers to an ethnicity, not a race. Hispanic residents can be of any race. All race categories in this analysis refer to non-Hispanic residents of those races.
