
Indiana’s GDP from then to now
Economist
What drives Indiana’s economy?
Everyone knows the answer to that question. But they have different answers. A large portion of Hoosiers will tell you that agriculture (including forestry, fishing and hunting) is the backbone of Indiana’s economy. However, others are equally certain that manufacturing is the dominant force in the state’s economy.
Farmers buy inputs from all sorts of firms that depend on them and their products go to the tables of every household. Nonetheless, businesses and households depend on durable manufactured goods to get to work (e.g., automobiles) and nondurables to stay healthy and beautiful (pharmaceuticals and cosmetics).
All of these products need to be moved from place to place. That puts transportation and warehousing right in the middle between producers and consumers. Well, not quite because we need retail in there as well—both with and without brick-and-mortar stores.
Indiana’s gross domestic product (GDP) is the foremost measure of value added by Indiana’s economic sectors. Figure 1 tells the tale. Agriculture and its relatives have not been as much as 2.5% of Indiana’s GDP at any time between 1997 and 2019. In half of those 22 years, that share has been less than 1.2%, and has fallen as low as 0.8%. That would be a remarkable backbone if it can serve as such while constituting so little of the state’s economy.
Figure 1: Shares of Indiana GDP
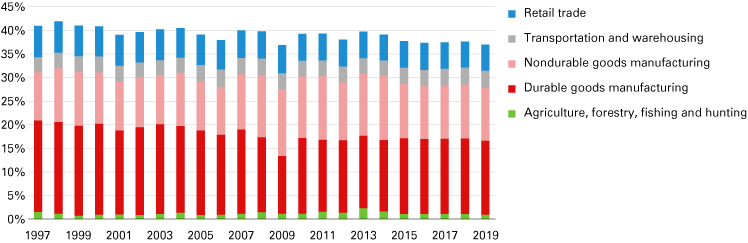
Source: U.S. Bureau of Economic Analysis
Durable goods manufacturing would have a better claim. Although not praised as the economy’s backbone, it has been called the state’s beating heart. It ranged from a high of 19.5% of Indiana's GDP in 1998 to a low of 12.2% in 2009. When we add in nondurable goods, manufacturing’s total share of our GDP reached a peak at 30.9% in 1998 and a low of 26.4% in 2009. As of 2019, durable and nondurable manufacturing combined for a 26.9% share of Indiana’s GDP. As such, manufacturing was the largest sector of Indiana’s economy over this period, but that did not constitute dominance.
When we add agriculture and manufacturing together, these two stalwarts of Indiana did not reach a third of the state’s GDP at any time between 1997 and 2019. Even when we add in transportation and warehousing, plus retail trade, we still have not reached 45% of Indiana GDP in Figure 1.
In addition, if you look carefully at Figure 1, you see the sum of these sectors is gradually declining from 42% to 37% of the state’s GDP. What’s growing to displace these longtime “favorite” sectors?
The rest of the team
Aside from the five sectors discussed above, we have data on another 15 sectors, not one of which exceeded 10 percent of the state’s GDP in 1997 or 2019. As seen in Figure 2, with one exception, changes in each sector's share were minor. There were no sensational changes in the structure of the state’s economy.
Figure 2: Shares of Indiana GDP for additional sectors
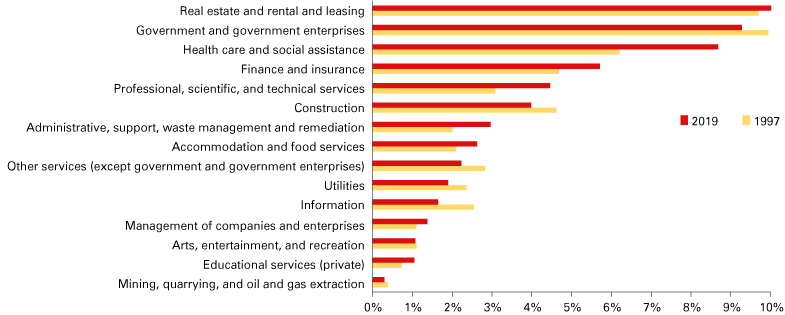
Source: U.S. Bureau of Economic Analysis
In 1997, government (federal, state and local) was the largest of the sectors (9.9%) followed closely by real estate and associated rental and leasing activities (9.7%). Twenty-two years later, the positions were reversed as real estate inched up by 0.3 percentage points and government slipped back by 0.7 percentage points.
Most of the sectors in Figure 2 grew in relative importance during this period. The greatest increase in share of GDP was found in health care and social assistance (+2.5 percentage points). A distant second was professional, scientific and technical services, up 1.4% percentage points.
The relative decline of government noted above was followed only by a notable decrease in the share of state GDP by information services (-0.9 percentage points). Without further data, we can only speculate a decline in local ownership of newspapers, radio/TV stations and other information providers has influenced Indiana’s decline in this sector.
Who is leading the race?
Normally, we look at rates of change—the speed of growth or decline—to see winners and losers. In Figure 3, the compound annual rate of growth for all sectors was 3.7%, led by the annual growth in administrative, support, waste management and remediation services (5.5%).
Figure 3: Compound annual percent change in GDP, 1997 to 2019
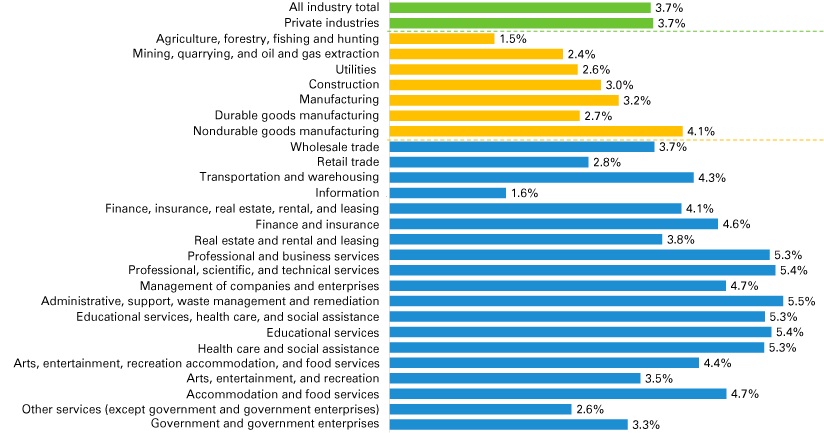
Source: U.S. Bureau of Economic Analysis
The lagging sectors are those in the goods-producing sectors (which are shown in yellow), with the exception of nondurable goods.
But our interest should also be drawn to how the race is run. Some long-distance runners get off to a fast start and then drag themselves over the finish line. Others get that burst of speed when the end of course is in sight. When it comes to economic performance, however, we might be most interested in the stability of the pace over time. Let’s see how Indiana’s various economic sectors performed over the 22 years from 1997, when we entered the era of cellphones and social networking. By 2019, we fell back on solid ground with low unemployment, low interest rates, an ever-rising stock market, and the very familiar inequality of rewards. Little were we prepared for what was coming in 2020.
Figure 4 presents a summary view of the percent changes in all sectors over all the years in this analysis. Despite high highs and low lows, the median percent change for all sectors of Indiana’s economy (shown in red), remains in a fairly narrow range between 7.3% and -1.6%. These median values (not adjusted for price changes) were positive except in 2009 when the Great Recession hit bottom.
Figure 4: Rates of change in GDP—Summary statistics
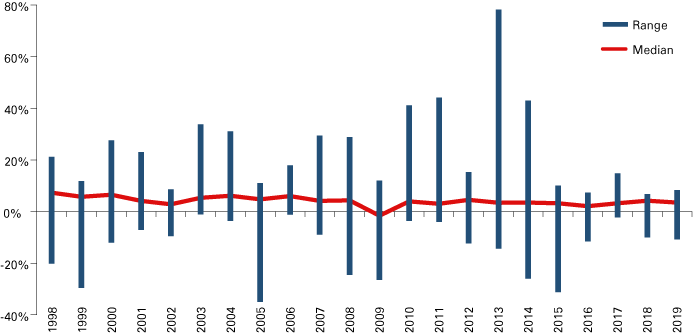
Source: U.S. Bureau of Economic Analysis
In Figure 5, the average (mean) growth rates for each sector are matched with the volatility in growth rates for those sectors. The average growth rate for the state was 3.7%. Volatility for each sector is measured as the variation around the mean divided by the mean. A value greater than one is taken to indicate high volatility, with values below one indicating more stability of growth. If the volatility measure were zero, that sector would have a constant rate of growth. The volatility measure for the state was 0.67, which indicates a fairly stable pattern of growth.
Figure 5: Average growth rates and volatility measures by sector
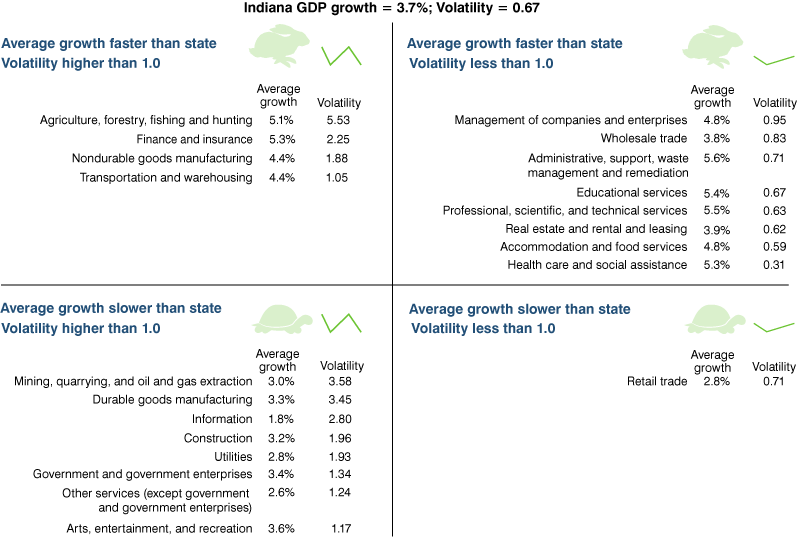
Source: U.S. Bureau of Economic Analysis
The agriculture sector has the highest volatility at 5.5, which accounts for the extreme ranges shown for many years in Figure 4. The health care and social assistance sector demonstrated the most positive pattern with a high average growth rate and very low volatility.
Final note
Virtually every firm and community seeks relatively high rates of economic growth. We have learned that very high rates of growth can have adverse costs arising from inadequacies in the development of supporting resources. Too many trucks and cars will clog streets with costly congestion. Moderate growth with low volatility allows for measured development of schools and services that grow along with development of primary sectors.
The issues ahead of us today are of change in the structure of the economy more than growth or volatility of the existing structure. The COVID-19 pandemic could make 2020 the inflection point of the growth path we have seen from the 1990s to the present. The future may require major changes to the way we measure progress with more adjustments for quality improvements.
