

Predicting unemployment from unemployment insurance claims
Economic Research Analyst, Indiana Business Research Center, Indiana University Kelley School of Business
Highlights
- Unemployment insurance (UI) claims are a good predictor for real-time unemployment rates.
- They can be used to forecast near-future unemployment for local areas, as well as industrial sectors.
- UI claims provide a quicker and more flexible read on the market that potentially benefits policymakers and economic researchers.
- In the case of Indiana, a 1% increase in continued UI claims on average responds to a 0.6% increase in monthly unemployment.
The U.S. Bureau of Labor Statistics (BLS) produces several estimates—labor force participation, employment, unemployment and unemployment rate—that serve as key indicators of national, regional and local economic conditions. These estimates have multiple uses, including federal funding allocations to states and areas. They are also used by private industry and researchers to monitor local labor supply. The BLS estimates are based on responses to a monthly survey of households. For states and local areas, unemployment claims are also used as an input to the estimation. (Keep in mind that not all unemployed persons file for unemployment benefits.)
As a result of the current and ongoing public health crisis (COVID-19), the Indiana Business Research Center (IBRC) team decided to see if we could use weekly state-and county-level unemployment claims data to develop a reasonable unemployment rate forecast that would fall in line with the official estimates later produced by BLS. While claims data are not used by the BLS for the calculation of the national unemployment rate, claims data do serve as inputs into the calculation of state and local area unemployment statistics (LAUS).1
An ad hoc approach to predict local unemployment was developed to calibrate the intrinsic relationship between unemployment rates and UI claims, which then can be used to make predictions about near-future unemployment. This article explores one possible approach to generate unemployment forecasts for regions and industry sectors.
When an employee becomes unemployed, he or she can apply for unemployment insurance, a joint state-federal financial relief program that provides benefits to eligible workers. There are basically two types of UI claims: initial claims, filed voluntarily by workers seeking unemployment benefits upon losing their jobs, and continued claims, those claims filed after the initial claim that were deemed eligible for unemployment benefits. Both are released on a weekly basis, yet continued claims come one week later than initial claims.
Continued claims are highly correlated with unemployment, with a correlation above 0.8. Figure 1 presents the adjusted monthly time series of continued claims along with unemployment from January 2008 to February 2020.
Figure 1: Indiana’s statewide unemployment and continued UI claims
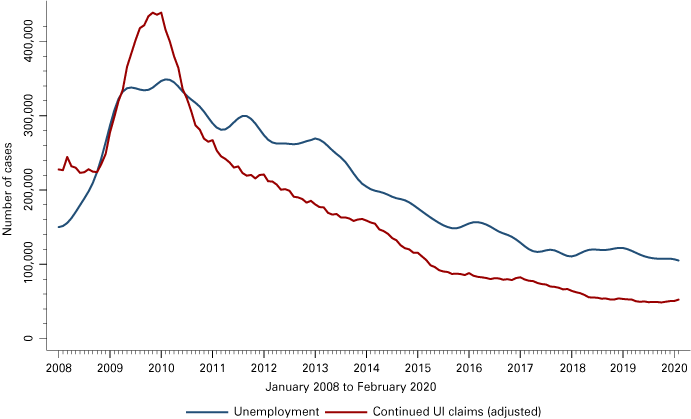
Source: STATS Indiana (unemployment data: www.stats.indiana.edu/laus_sa/laus_view3.html) and Hoosiers by the Numbers (continued UI claims: www.hoosierdata.in.gov/dpage.asp?id=58&view_number=2&menu_level=&panel_number=2)
Methodology
Since UI claims and unemployment have such a strong linear relationship, we could use UI claims directly as a linear predictor for unemployment. The data we used for this exercise are the Indiana monthly unemployment claims for January 2008 through February 2020. We first completed log-transformations of the data for two reasons. One is to tamper down possible distortion and the other is for easier interpretation.
Specifically, we estimated the following regression model:
where ![]() is the intercept that tells us the average unemployment over the time span we studied;
is the intercept that tells us the average unemployment over the time span we studied; ![]() is the slope coefficient that tells us the “response” rate of unemployment to UI claims—that is, a 1% increase in UI claims is associated with a
is the slope coefficient that tells us the “response” rate of unemployment to UI claims—that is, a 1% increase in UI claims is associated with a ![]() percent increase in unemployment;
percent increase in unemployment; ![]() is the error term. We also included in the model a binary variable for months in recession years (2008 and 2009), so as to isolate the recession effect—represented by the data points shown in red on Figure 2.
is the error term. We also included in the model a binary variable for months in recession years (2008 and 2009), so as to isolate the recession effect—represented by the data points shown in red on Figure 2.
Figure 2: Unemployment versus continued UI claims
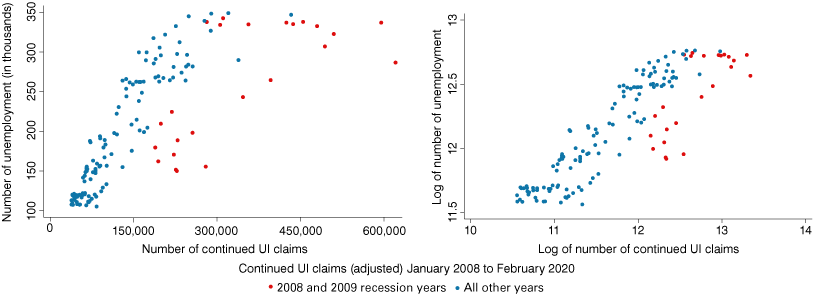
Source: Indiana Business Research Center
After estimating the log of unemployment from the linear model, we calculated the level of unemployment by taking the exponential of estimated values. To “estimate” (calculate) the unemployment rate, simply divide the estimated unemployment level by the labor force count in the same geographic area.
Results and discussions
This is the estimated linear equation for the state of Indiana:

The slope coefficient tells us that a 1% increase in UI claims is on average associated with a 0.6% increase in unemployment.
This essentially tells us that not every UI beneficiary is counted as unemployed, although the majority of them are. Some workers lost their jobs, went through a transitional phase and eventually found new jobs. It is also possible that some of them were out of the job market altogether.
The negative coefficient for recession months tells us there is a slightly parallel shift of the linear line—down to the right—for that period. (It’s not hard to imagine that one can fit another parallel line through the red data points, apart from the one that the vast majority of blue data points cluster around in the right scatterplot in Figure 2.) The overall fit of the model is very good—85% of variation in unemployment can be explained by the variation in UI claims.2 Figure 3 overlays the time series of estimated and “actual” unemployment, and one can see the two align with each other closely over time.3
Figure 3: Estimated versus “actual” unemployment
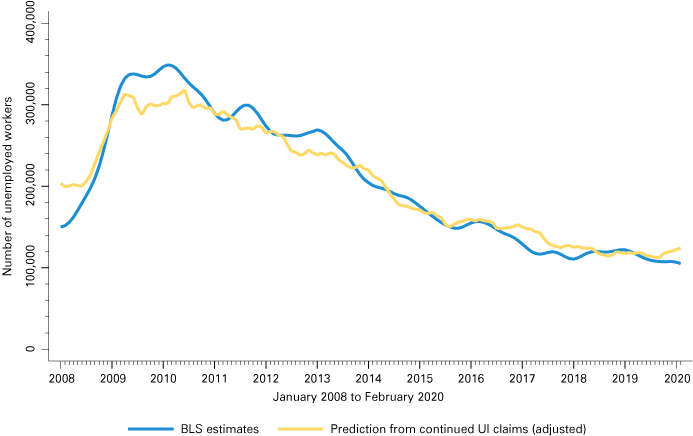
Source: STATS Indiana and IBRC estimates
The same approach can be applied to other geographic areas. Figure 4 shows forecasted versus “actual” unemployment rates for selected Indiana metropolitan areas. Overall, our model fits the unemployment dynamics well. The “response” rate of unemployment to UI claims is the highest (0.62) for both the Elkhart-Goshen and Indianapolis-Carmel-Anderson metro areas, followed by Columbus (0.53) and Bloomington (0.42).
Also notice that the model tends to underestimate large spikes, as seen in the Columbus and Elkhart-Goshen metropolitan areas—both of which are manufacturing oriented. Elkhart is the world capital of recreational vehicles (RVs), and RV manufacturing was severely dampened during the last recession.
Figure 4: Estimated versus actual unemployment rates for selected Indiana metropolitan areas
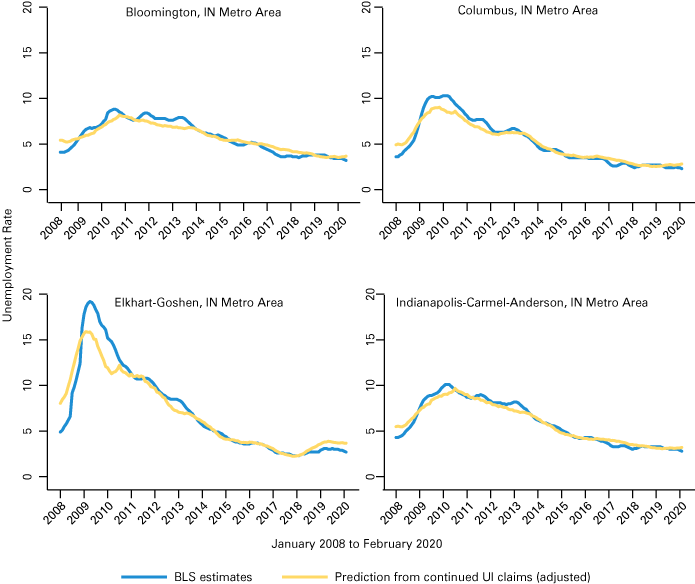
Source: STATS Indiana and IBRC estimates
Unemployment for industry sectors is often not reported, but may be of great interest to regional planners. To obtain a rough estimate on unemployment by industry sector, we assigned the regional unemployment proportionally to its underlying sectors by their proportions in UI claims. For example, if manufacturing accounts for 20% of UI claims for Elkhart, then it also accounts for 20% of the regional unemployment.
Figure 5 presents the times series of unemployment for Indiana’s top sectors. Manufacturing has accounted for the most job loss in Indiana over time, and its workers also saw the highest unemployment during the Great Recession. Workers in administrative support, retail, construction, and transportation and warehousing, are also more prone to losing jobs. Unemployment in construction is relatively stable over time, and didn't jump up too much even during the last recession, which was triggered by the housing market crash. We also see that the response to the Great Recession in other sectors came more slowly and gradually relative to the spike in manufacturing unemployment.
Figure 5: Monthly unemployment for Indiana’s top industrial sectors
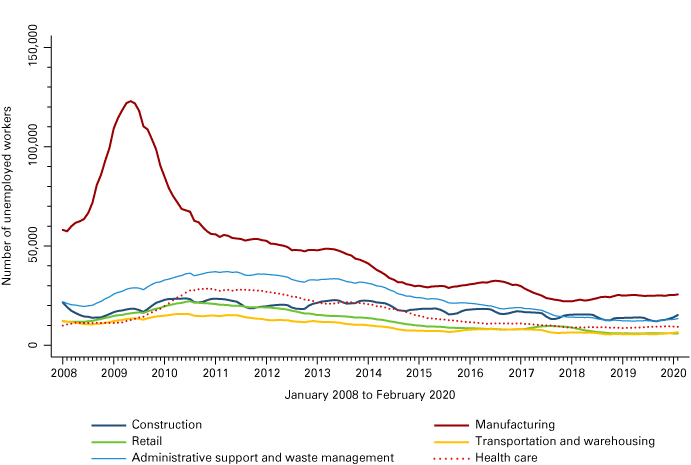
Source: IBRC estimates
The “response” rate of unemployment to UI claims is the largest (0.68) for construction, with manufacturing, health care, transportation and warehousing, retail, and administrative support varying between 0.55 and 0.58.
Summary
We’ve demonstrated a simple statistical method that uses UI claims to generate unemployment at regional (sub-state) and sectoral (industry) levels. The estimated parameters can be used to make predictions about near-future labor statistics. It is important to keep in mind that parameter values differ across regions and would also change as the time periods are altered. Thus, one needs to run the model separately for different regions and update the model once new data become available.
For more information on unemployment rates and claims, visit the Hoosiers by the Numbers Unemployment topic page.
Notes
- U.S. Bureau of Labor Statistics, “Estimation Methodology,” www.bls.gov/lau/laumthd.htm.
- The (adjusted) R2 of the model—used to assess a linear model’s goodness of fit—is 0.85.
- The six-month backward and forward moving average was calculated to smooth out the time series of estimated unemployment.
