Richmond forecast 2021

Director of the Business and Economic Research Center and Associate Professor of Finance, Indiana University East
Total personal income and per capita personal income (PCPI) of Wayne County increased by a bigger percentage in 2018 (the most current data available at the time of this writing) relative to the prior year. The broader Richmond region1 had about the same growth pattern as Wayne County in 2018. Wayne County’s PCPI lagged behind Franklin County and Rush County within the region. Some more recent indicators illustrate that economic activity in the region declined in 2020. The labor force shrank and the unemployment rate surged for both Wayne County and the region. More than 600 private sector jobs were lost in Wayne County this year, compared to a single-digit loss last year. The region as a whole lost over 1,200 private sector jobs. On the other hand, the average weekly wage of private sector jobs in both Wayne County and the region slightly increased, with the growth percentage of the region more than double that of Wayne County. Wayne County's home sale prices rose significantly. The IU East Regional Business Confidence Index and its sub-indexes all recorded declines.
Income
Both Wayne County and the region continued to trend upward in total personal income in 2018 (see Figure 1). The region’s total personal income also started to diverge more on the upside from the trend line. This illustrates a persistent improvement in the economic activity and living standard in the county. At the same time, the region improved by more than would have been predicted by the trend line. Wayne County’s total personal income was $2,736,654,000 in 2018, up by 4.4% from the 2017 level and ranked 26th in the state of Indiana.
Figure 1: Region and Wayne County’s total personal income
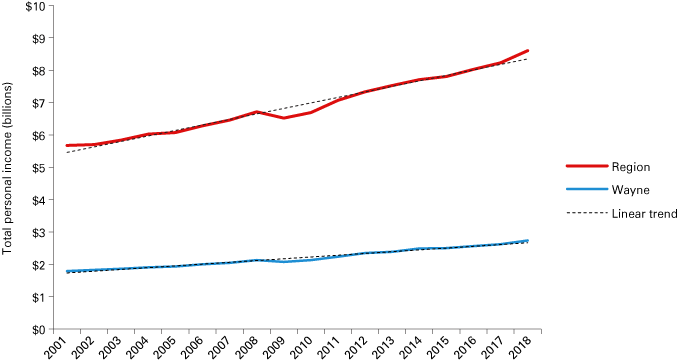
Note: Wayne County has approximately 31.8% of the region's income and 31.6% of its population based on the 2018 data.
Source: U.S. Bureau of Economic Analysis (BEA) Regional Fact Sheets
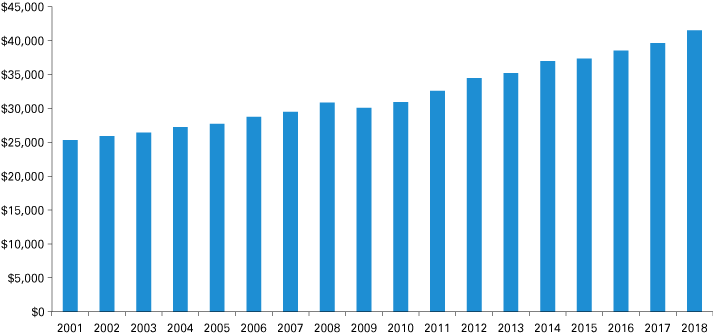
Wayne County had a PCPI of $41,505 in 2018, up from 2017 by 4.7% (see Figure 2). This level was 88% of Indiana’s average of $47,149.
Figure 2: Wayne County’s per capita personal income over time
Source: U.S. Bureau of Economic Analysis (BEA) Regional Fact Sheets
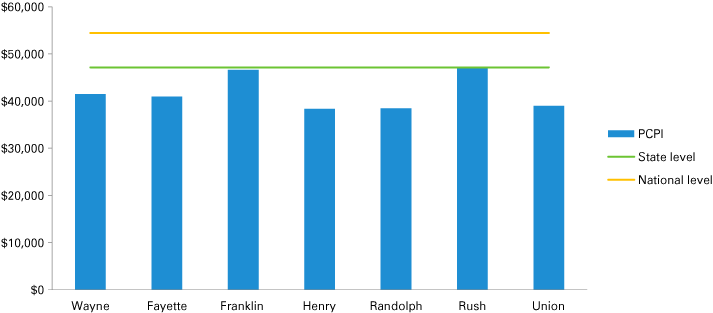
Wayne County’s PCPI—ranked 52nd among the state’s 92 counties—continued to lag behind Franklin County ($46,629, 19th) and Rush County ($46,945, 16th), which were the only counties catching up to the state average. The others in the region were falling behind significantly by over 10% (see Figure 3).
Figure 3: County-level per capita personal income, 2018
Source: U.S. Bureau of Economic Analysis (BEA) Regional Fact Sheets
Labor market
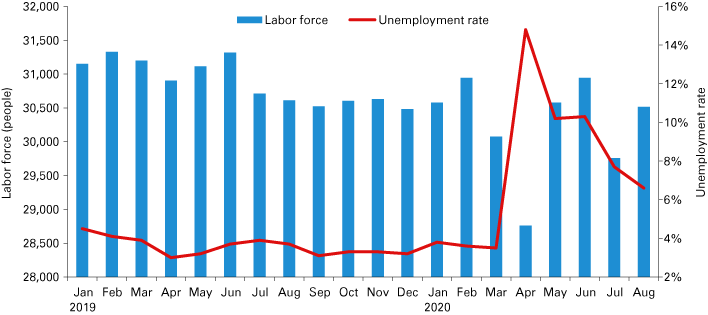
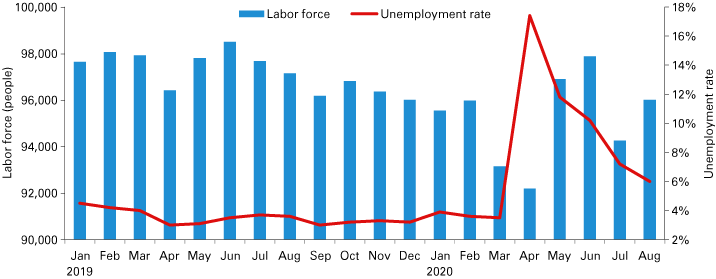
Wayne County’s labor force was made up of 30,516 people in August 2020, representing 31.8% of the region’s total labor force of 96,001 people (see Figure 4 and Figure 5). The county had an average monthly size of labor force of 30,269 people for the first eight months in 2020, down by 2.5% from the same period in 2019. The region also saw the same percentage decrease in the labor force.
Figure 4: Wayne County’s labor force and unemployment rate
Note: Data are not seasonally adjusted.
Source: Local Area Unemployment Statistics (LAUS) from the U.S. Bureau of Labor Statistics
Wayne County’s monthly unemployment rate averaged 3.6% in the first quarter of 2020. It went up to 14.8% in April, then down to about 10% in the following two months. The county saw a further drop to about 7% in July and August. Although the region had about the same monthly unemployment rate average in the first quarter of 2020, as a whole, it suffered a higher unemployment rate in April (17.4%) and May (11.8%), as shown in Figure 5.
Figure 5: Region’s labor force and unemployment rate
Note: Data are not seasonally adjusted.
Source: Local Area Unemployment Statistics (LAUS) from the U.S. Bureau of Labor Statistics
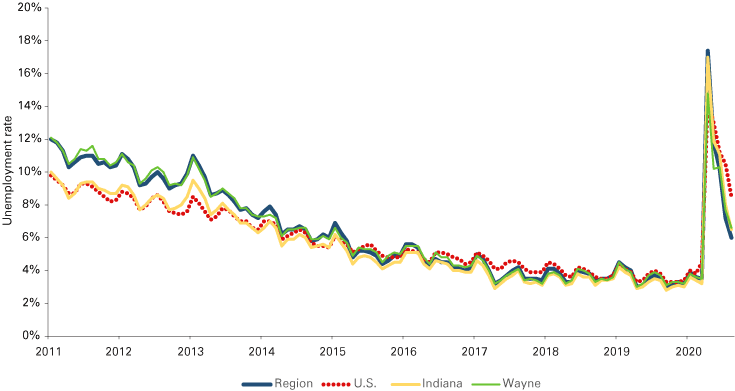
During the most difficult time (April and May, as a result of Indiana’s lockdown to curb the spread of COVID-19),2 unemployment skyrocked (see Figure 6). Over the first eight months in 2020, Wayne County came out slightly better than the region and the state as measured by the average unemployment rate. Wayne County’s average monthly unemployment rate was 7.6% compared to 8% for the region and the state during these eight months.
Figure 6: Unemployment rate comparison
Note: Data are shown through August 2020 and are not seasonally adjusted.
Source: Local Area Unemployment Statistics (LAUS) from the U.S. Bureau of Labor Statistics
Jobs and wages
Wayne County’s private sector lost 652 jobs in the first quarter of 2020 as compared with the first quarter of the previous year (see Table 1). Such job loss accounted for over 50% of the total private job loss in the region.
The amount of job loss in administrative, support, waste management and remediation contributed to more than half the private sector job loss in Wayne County. Both manufacturing and health care and social services lost over 80 jobs. The next hardest-hit industries were finance and insurance and accommodation and food services, both of which lost 45 jobs or more. The one-year change suggests that transportation and warehousing experienced a significant growth in employment by adding 62 jobs. The region as a whole saw a significant expansion in construction and accommodation and food services as estimated from the available data.
Table 1: Employment by industry
| Industry | Wayne County | Region | State | |||
|---|---|---|---|---|---|---|
| 2020 Q1 | One-year change | 2020 Q1 | One-year change | 2020 Q1 | One-year change | |
| Total all | 29,709 | -619 | 65,396 | -1,364 | 3,034,501 | -11,684 |
| Total private | 25,424 | -652 | 53,493 | -1,252 | 2,635,976 | -13,939 |
| Manufacturing | 5,834 | -82 | 13,667 | -170 | 534,483 | -8,955 |
| Retail trade | 3,633 | 7 | 7,806 | -176 | 309,626 | -6,036 |
| Transportation and warehousing | 708 | 62 | 1,256(D) | -11(ED) | 140,422 | 4,004 |
| Agriculture, forestry, fishing and hunting | 229 | 1 | 275(D) | 1 (ED) | 14,750 | 121 |
| Mining | 22 | -2 | 41(D) | 0(ED) | 5,500 | -120 |
| Utilities | 51 | -8 | 170(D) | -8 (ED) | 13,915 | 15 |
| Construction | 767 | -11 | 2,442 | 134 | 139,411 | 3,275 |
| Wholesale trade | 722 | -26 | 1,635(D) | -45(ED) | 122,334 | 216 |
| Information | 185 | -14 | 445(D) | -26(ED) | 28,038 | -721 |
| Finance and insurance | 840 | -46 | 1,616(D) | -89(ED) | 98,862 | 782 |
| Real estate and rental and leasing | 144 | 6 | 354 | -24 | 35,828 | 166 |
| Professional, scientific, technical | n/a(D) | n/a(ED) | 417(D) | -603(ED) | 125,627 | 3,625 |
| Management of companies and enterprises | n/a(D) | n/a(ED) | 53(D) | -253(ED) | 35,098 | 318 |
| Administrative, support, waste management and remediation | 1,430 | -358 | 2,396(D) | -170(ED) | 176,679 | -4,958 |
| Educational services | 568 | -16 | 593(D) | -14(ED) | 51,778 | -819 |
| Health care and social services | 5,946 | -85 | 7,156(D) | -206(ED) | 414,813 | 123 |
| Arts, entertainment and recreation | 126 | -2 | 271 | -18(ED) | 38,227 | -209 |
| Accommodation and food services | 2,883 | -45 | 5,746 | 444(ED) | 262,212 | -4,385 |
| Other services (except public administration) | 661 | -10 | 1,548(D) | 1(ED) | 88,372 | -279 |
| Government | 4,285 | 33 | 11,904 | -114 | 398,525 | 2,255 |
Notes: n/a stands for not available due to data unavailability for 2020 Q1. (D) indicates data with one or more counties excluded due to disclosure issues and (ED) indicates an estimate made based on such data for 2019 Q1 and/or 2020 Q1.
Source: Quarterly of Employment and Wage (QCEW) data from the U.S. Bureau of Labor Statistics, downloaded via Hoosier by the Numbers
The average weekly wage for all private jobs was 3.2% higher in Wayne County relative to the regional average in the first quarter of 2020, but the growth percentage for Wayne County was less than half of the growth percentage for the region (see Table 2). In Wayne County, mining, construction, information, and finance and insurance underwent significant increases in weekly wages, while utilities cut weekly wages by as much as one-fifth. For the region, the industries that had a significant rise in weekly wages included construction, real estate, rental and leasing, as well as arts, entertainment and recreation.
Table 2: Average weekly wage by industry
| Industry | Wayne County | Region | State | |||
|---|---|---|---|---|---|---|
| 2020 Q1 | One-year change | 2020 Q1 | One-year change | 2020 Q1 | One-year change | |
| Total all | $780 | 2.4% | $756 | 4.9% | $994 | 3.2% |
| Total private | $784 | 2.3% | $760 | 5.0% | $1,002 | 3.1% |
| Manufacturing | $946 | 0.7% | $969 | 3.0% | $1,362 | 1.4% |
| Retail trade | $490 | 2.1% | $490 | 3.8% | $570 | 4.8% |
| Transportation and warehousing | $967 | -3.0% | $934(D) | 1.2%(ED) | $907 | 2.0% |
| Agriculture, forestry, fishing and hunting | $659 | -5.3% | $644(D) | -1.5%(ED) | $791 | 6.2% |
| Mining | $744 | 17.2% | $688(D) | 15.1%(ED) | $1,364 | -0.8% |
| Utilities | $2,682 | -20.4% | $2,042(D) | -13.1%(ED) | $2,162 | -4.1% |
| Construction | $831 | 11.5% | $845 | 7.0% | $1,120 | 3.9% |
| Wholesale trade | $1,075 | 3.9% | $945(D) | 5.1%(ED) | $1,421 | 1.9% |
| Information | $819 | 18.2% | $703(D) | 8.2%(ED) | $1,249 | 2.1% |
| Finance and insurance | $1,163 | 8.5% | $1,107(D) | 6.9%(ED) | $1,742 | 6.3% |
| Real estate and rental and leasing | $613 | 0.0% | $587 | 7.9% | $981 | 4.6% |
| Professional, scientific, technical | n/a(D) | n/a(ED) | $745(D) | -7.3%(ED) | $1,379 | 3.8% |
| Management of companies and enterprises | n/a(D) | n/a(ED) | $1,170(D) | -27.3%(ED) | $2,361 | -6.9% |
| Administrative, support, waste management and remediation | $527 | 0.6% | $639(D) | 6.7%(ED) | $662 | 4.7% |
| Educational services | $771 | 4.9% | $747(D) | 4.9%(ED) | $770 | 3.2% |
| Health care and social services | $970 | 1.9% | $983(D) | 10.0%(ED) | $972 | 5.0% |
| Arts, entertainment and recreation | $318 | -3.0% | $382 | 11.7% | $707 | -1.5% |
| Accommodation and food services | $297 | 3.1% | $282 | 1.4% | $331 | 5.1% |
| Other services (except public administration) | $502 | 1.2% | $470(D) | 5.9%(ED) | $650 | 3.5% |
| Government | $864 | 0.2% | $818 | 1.1% | $1,087 | 1.5% |
Notes: n/a stands for not available due to data unavailability for 2020Q1. (D) indicates data with one or more counties excluded due to disclosure issues and (ED) indicates an estimate made based on such data for 2019 Q1 and/or 2020 Q1.
Source: Quarterly Census of Employment and Wage (QCEW) data from the U.S. Bureau of Labor Statistics, downloaded via Hoosier by the Numbers
Housing market
In Wayne County, single-family home sales were slightly higher in number, accompanied by a significant increase in the median sales price during the first eight months of 2020, as compared to the prior year (see Table 3). There were 569 single-family homes sold in the county, with $110,000 as the median sales price. This pattern resembled (and was slightly better than) the rest of Indiana on all home sales. According to Tracie Robinson of Better Homes and Gardens First Realty Group, the substantial increase in the median price was primarily due to the low interest rates, which enabled buyers to purchase more expensive houses without necessarily increasing their monthly payments. Low inventory was another contributing factor to this price increase. On the other hand, sellers were able to get closer to list price and, in some cases, even higher than list price due to demand and multiple offers.
While Fayette County and Randolph County recorded a slight decline in home sales (along with a rise in median sales price), Rush County had a much greater decline in sales, with only one home sold. Union County had large increases (in percentage terms) in home sales and median price. Franklin County and Henry County had significant increases in home sales. Median prices were about the same for Franklin County and significantly lower for Henry County when compared to 2019.
Table 3: Year-to-date housing market update
| Closed sales | Median price | |||
|---|---|---|---|---|
| 2020 | One-year change | 2020 | One-year change | |
| Statewide (excluding Wayne County) | 59,785 | 0.0% | $182,500 | 8.0% |
| Fayette | 97 | -2.0% | $71,500 | 3.3% |
| Franklin | 164 | 25.2% | $155,500 | -0.6% |
| Henry | 303 | 5.6% | $93,750 | -6.2% |
| Randolph | 153 | -4.4% | $82,500 | 5.8% |
| Rush | 1 | -80.0% | $117,900 | 58.3% |
| Union | 10 | 233.3% | $114,250 | 31.3% |
| Wayne* | 569 | 1.1% | $110,000 | 11.1% |
* Single-family homes only
Note: Year-to-date data (including detached single-family homes, condos and townhomes) reflect January through August data
Source: Indiana Real Estate Market Report by the Indiana Association of Realtors, except Wayne County's data, which were provided by Better Homes and Gardens First Realty Group
Outlook
The value of the composite IU East Regional Business Confidence Index dropped by 10.3% to 80.7 points in 2020, as compared with the previous year (see Table 4). While both sub-indexes also dropped in value, the Present Situation Index recorded a massive decline, whereas the Expectation Index had a minor decline. These numbers suggest that the businesses in the region experienced a much more difficult time this year than last year and still expect a difficult time next year—although not as bad as this year.
Table 4: IU East Regional Business Confidence Index and its sub-indexes
| 2019 | 2020 | 2019 | 2020 | ||
|---|---|---|---|---|---|
| IU East Regional Business Confidence Index value | 100.0 | 89.7 | IU East Regional Business Confidence Index score | 2,417 | 2,168 |
| Annual change | -10.3% | ||||
| Present Situation Index value | 100.0 | 80.5 | Present Situation Index score | 1,048 | 844 |
| Annual change | -19.5% | ||||
| Expectation Index value | 100.0 | 95.4 | Expectation Index score | 1,028 | 981 |
| Annual change | -4.6% | ||||
Note: Due to the expansion in the survey coverage of last year, the 2019 scores were used as the new base year scores.
Source: Richmond forecast 20203 and the 2020 East-Central Indiana Business Survey, conducted by IU East Business and Economic Research Center, September-October 2020
Only one-third of the surveyed businesses were able to increase their production/business activity in 2020 (see Table 5). On the other hand, about half of them had suffered a decline. While more than half of surveyed businesses hired the same number of employees, only about a quarter of them enlarged their employee pools. Forty percent of the businesses maintained their capital investment at the same level as the year before, whereas another 40% increased their capital investment. Over 60% of the survey participants found that their firm’s cost of doing business had increased. One-third of the surveyed businesses increased their profits, whereas about three-tenths managed to maintain their profit level.
Table 5: Compared to the same period last year, how has each of the following changed for your business/company?
| Answer option | Has increased significantly (>5%) | Has increased slightly (<5%) | Has remained about the same | Has decreased slightly (<5%) | Has decreased significantly (>5%) | Response count |
|---|---|---|---|---|---|---|
| Production/business activity | 25.3% | 9.1% | 17.2% | 25.3% | 23.2% | 99 |
| Number of employees | 10.2% | 13.3% | 56.1% | 14.3% | 6.1% | 98 |
| Capital investment | 15.2% | 25.3% | 40.4% | 14.1% | 5.1% | 99 |
| Cost of doing business | 17.0% | 44.0% | 30.0% | 5.0% | 4.0% | 100 |
| Profitability | 10.3% | 22.7% | 28.9% | 24.7% | 13.4% | 97 |
Source: The 2020 East-Central Indiana Business Survey, conducted by IU East Business and Economic Research Center, September-October 2020
Comparing next year (2021) with this year (2020) on the same aspects, over 80% of survey participants would expect their firms to increase or at least maintain the same level of production/business activity in 2021 (see Table 6). While over half of the businesses anticipate continuing to hire the same number of employees, a third of them would expect to add more employees and less than one-tenth had plans to cut their employment level for next year. A similar distribution was anticipated in their capital investment as well. On the other hand, over half of the survey participants expect to see an increase in their firms’ cost of doing business in 2021, while only 5% expect a lower cost of doing business for next year. As far as for the profitability of their firms, more than three-quarters of the survey participants had hopes of generating a higher profit or at least maintaining the same level next year.
Table 6: How do you anticipate each of the following will change next year for your business/company as compared with this year?
| Answer option | Will increase significantly (>5%) | Will increase slightly (<5%) | Will remain about the same | Will decrease slightly (<5%) | Will decrease significantly (>5%) | Response count |
|---|---|---|---|---|---|---|
| Production/business activity | 23.0% | 33.0% | 25.0% | 14.0% | 5.0% | 100 |
| Number of employees | 6.9% | 26.7% | 57.4% | 7.9% | 1.0% | 101 |
| Capital investment | 9.9% | 22.8% | 55.4% | 9.9% | 2.0% | 101 |
| Cost of doing business | 12.0% | 44.0% | 39.0% | 4.0% | 1.0% | 100 |
| Profitability | 12.1% | 34.3% | 29.3% | 21.2% | 3.0% | 99 |
Source: The 2020 East-Central Indiana Business Survey, conducted by IU East Business and Economic Research Center, September-October 2020
A quarter of the surveyed businesses anticipate that economic conditions in 2021 will remain about the same as in 2020, more than half of them were optimistic, and less than one-fifth were pessimistic about 2021’s business and economic conditions (see Table 7).
Table 7. How do you project the overall business and economic conditions in 2021 in your area?
| Answer option | Response percent | Response count |
|---|---|---|
| Strongly optimistic | 8.0% | 8 |
| Moderately optimistic | 48.0% | 48 |
| About the same | 25.0% | 25 |
| Moderately pessimistic | 17.0% | 17 |
| Strongly pessimistic | 2.0% | 2 |
| Total | 100.0% | 100 |
Source: The 2020 East-Central Indiana Business Survey, conducted by IU East Business and Economic Research Center, September-October 2020
After calling the COVID-19 global pandemic the worst crisis since the Great Depression, the International Monetary Fund (IMF) projects global economic growth of -4.4% for 20204 and a rebounding growth of 5.2% for 2021. The Federal Open Market Committee (FOMC) revised their forecast of the U.S. GDP growth for 2020 to -3.7 percent,5 more optimistic than the one (-4.2%) concluded from the Wall Street monthly economic survey,6 which aligned more closely to the IMF estimate (-4.3%). At the same time, the FOMC’s U.S. GDP outlook for 2021 was revised to 4.0%—0.9% higher than the one made by the IMF.
Summary
Facing the enduring global pandemic brought about by a highly contagious virus, both Wayne County and the region cannot be shielded from its resulting negative economic impact, particularly the storefront businesses with low or zero flexibility to go online. The unemployment rate for the region is expected to swing quite widely around the 6% mark through next year, provided that no further lockdown of in-person public activities will occur. The actual economic growth of the region for next year will also depend on the result of any policy changes from the federal government and the new administration.7
Acknowledgements
The author deeply appreciates the feedback and support provided by Dr. Litao Zhong, Associate Professor of Economics and Finance, and Dr. Denise S. Smith, Dean of the School of Business and Economics. Thanks also go to Tracie Robinson, Broker Associate/Sales Manager of Better Homes and Gardens First Realty Group, for providing Wayne County’s housing data.
Notes
- The Richmond region includes seven east-central Indiana counties: Fayette, Franklin, Henry, Randolph, Rush, Union and Wayne.
- In response to the rising cases of the coronavirus in Indiana, Governor Eric Holcomb issued a statewide stay-at-home order on March 16, effective from 11:59 p.m. March 24 to 11:59 p.m. April 6. The order was then extended through May 1.
- Oi Lin Cheung, “Richmond forecast 2020,” Indiana Business Review, Winter 2019.
- International Monetary Fund, “World economic outlook, October 2020: A long and difficult ascent,” October 2020.
- Federal Open Market Committee, “Transcript of Chairman Powell’s September 2020 press conference” and accompanied economic projection table, September 16, 2020.
- Harriet Torry and Anthony DeBarros, “WSJ survey: Overall economy is recovering faster than economists expected,” Wall Street Journal, September 10, 2020.
- “Election 2020: How Trump and Biden compare on the key issues,” Wall Street Journal, October 15, 2020.


