Louisville forecast 2021

Sanders Chair in Business and Professor of Finance, Indiana University Southeast, New Albany
The year 2020 will go down as a year that observed both the steepest job losses and largest gains for the Louisville metro. April saw unprecedented job losses due to pandemic-induced shutdowns. In the months following, job gains have been strong relative to normal economic conditions, but have yet to fully recover from the massive job losses in the first half of the year. In 2021, we will see additional job gains, and the region is expected to fully recover job losses by late 2021. In sum, the outlook is optimistic for the Louisville metro.
Louisville metro payrolls
April represents the bottoming of the 2020 recession. The Louisville metro saw job losses of 123,000 from the pre-recession February high of 681,500 to the April recession low of 559,300. The April total is equivalent to the level of jobs that existed in April 1996. From May to June, the area quickly recovered 41,000 jobs, the largest gain going back to 1991. Since that time, month-over-month job gains are decelerating, but remain higher than historical month-over-month gains. Year-over-year job losses are now slightly higher than the deepest level that existed during the Great Recession.
Figure 1: Louisville metro nonfarm employment
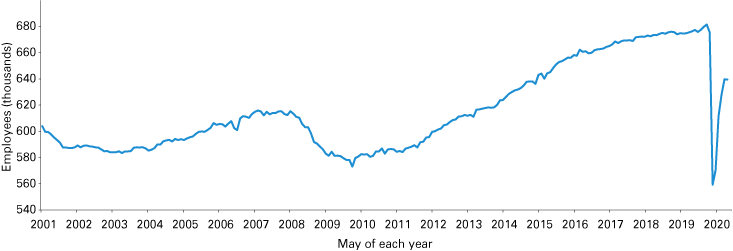
Note: Data are shown from May 2001 to September 2020.
Source: FactSet
Sector growth
Job losses and subsequent gains were primarily concentrated in manufacturing, leisure and hospitality, retail, professional and business services, and education and health services. In April, these five sectors had combined year-over-year job losses of 91,300—with more than a third of losses occurring in leisure and hospitality. As of September 2020, these five sectors had year-over-year combined losses of 23,600, a considerable improvement from April. Other sectors also saw losses, but the magnitude was not as large due to their smaller sizes.
We expect growth across all sectors to continue into 2021, inching the region to a level that will erase all job losses by later 2021.
Figure 2: Year-over-year change in payroll jobs for selected Louisville metro sectors
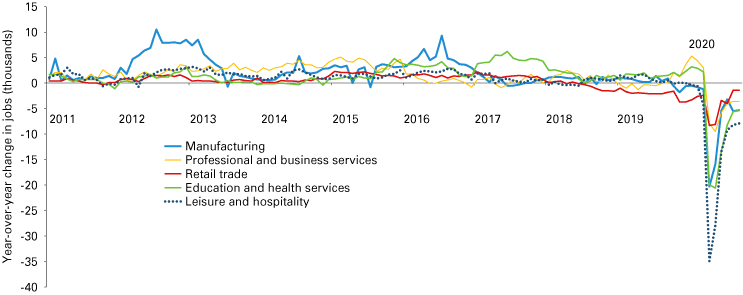
Note: Data are shown through September 2020.
Source: FactSet
Southern Indiana
The year 2019 began with a very strong quarter for Southern Indiana, gaining 1,900 jobs and making it the strongest year-over-year job growth since 2016. Unfortunately, job gains over the rest of 2019 were subdued; one quarter showed negative growth from the previous year. With the nation’s recession beginning in the first quarter of 2020, the region saw a small decline in jobs and no growth from the previous year. Manufacturing, retail, accommodation and food services, and health care and social services saw the largest declines. Transportation and warehousing showed sizable gains. Clark County added over 600 jobs, with Floyd and Washington counties losing 314 and 231, respectively.
Figure 3: Change in Southern Indiana payroll jobs
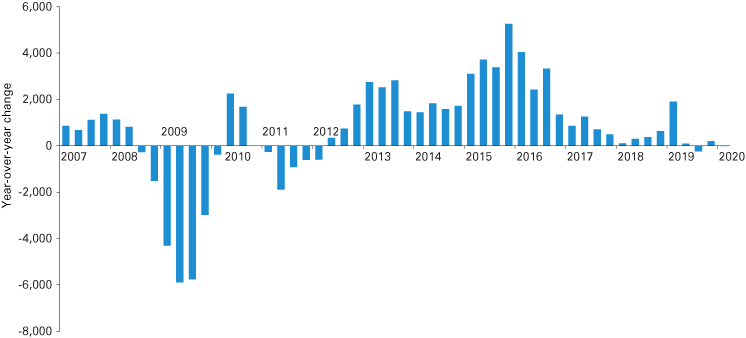
Note: Data are shown through first quarter 2020.
Source: STATS Indiana, using Quarterly Census of Employment and Wages data from the U.S. Bureau of Labor Statistics
The five-county Southern Indiana region1 saw year-over-year declines in employment that were more than four-and-a-half times the declines observed during the Great Recession. Year-over-year employment declined by 31,662 in April; the most recent decline is slightly more than 8,000—a little worse than the lowest level that existed during the Great Recession. We expect the Southern Indiana employment deficit to be erased by the latter part of 2021.
Figure 4: Change in Southern Indiana employment
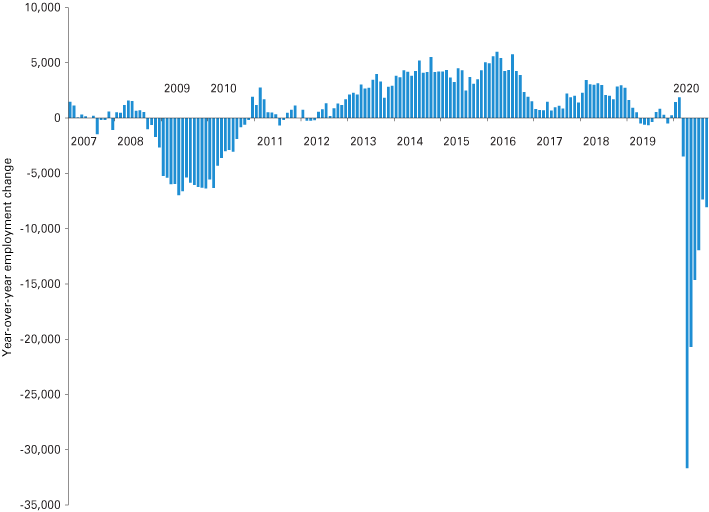
Note: Data are shown through September 2020.
Source: FactSet
Job postings
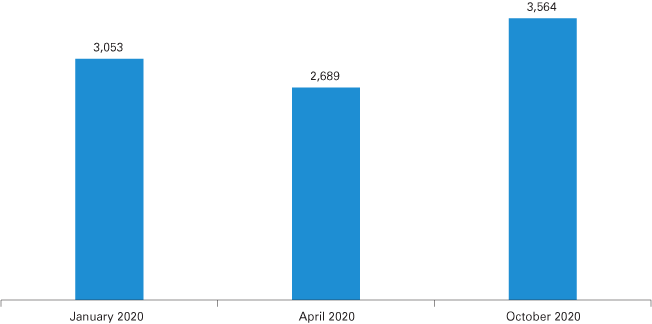
Hiring across Southern Indiana hit a recession low in the month of April, with job postings running approximately 12% below levels that existed in January 2020. Postings in October are now exceeding the pre-pandemic levels that existed in January (see Figure 5). Two of the top three occupations emerging after summer 2020 were related to transportation and logistics: 1) heavy and tractor-trailer truck drivers and 2) laborers and freight, stock and material movers (registered nurses was third). Just before the pandemic, the top three occupations in highest demand were retail salespersons, heavy and tractor-trailer truck drivers, and registered nurses.
Figure 5: Southern Indiana job postings
Source: Labor Insight from Burning Glass Technologies
Building permits
Clark County continues to lead all other counties combined in the level of building permits issued. Building permits in Clark County were more than double all other counties combined in 2019. A similar pattern is observed during 2020, but overall permits may be under 2019. The continued expansion of River Ridge and growth taking place around the East End Bridge will continue to contribute to strong residential development for Clark County.
Figure 6: Southern Indiana total building permits
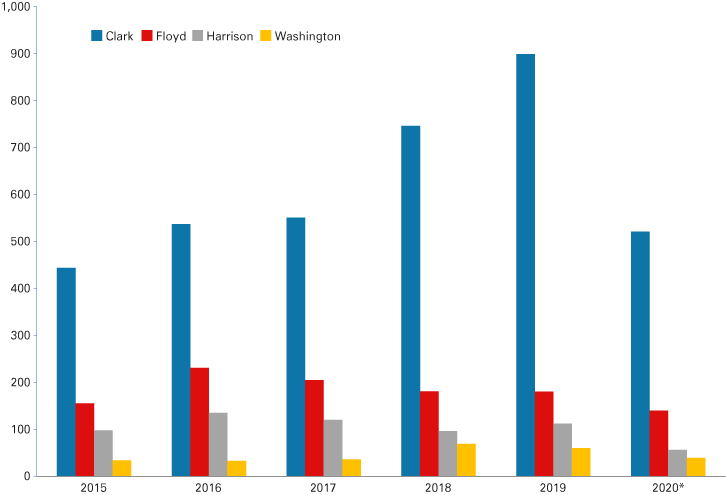
*2020 reflects a January-August total.
Source: State of the Cities Data Systems building permits database
Outlook
The nation will see another round of fiscal stimulus. The size rests on what political party ends up controlling the Senate. As of this writing, it appears that there will be a split government. Regardless of that outcome, any fiscal stimulus will provide additional support for growth. Fiscal stimulus, in addition to improving unemployment rates and the overall financial strength of the household, will result in positive job gains for the Louisville metro. We anticipate that the region will fully recover lost jobs by the end of 2021. Growth is expected across all sectors, with strength in manufacturing, professional and business services, leisure and hospitality, transportation and warehousing, and health care. Stronger household balance sheets, coupled with favorable manufacturing indicators, imply an above-average year for job growth in the Louisville metro. Uncertainty with respect to fiscal and tax policy and a different regulatory regime, in addition to virus-related impacts on travel, could provide strong headwinds to the outlook.


