Housing: Positive outlook for resilient Indiana market

Senior Demographic Analyst, Indiana Business Research Center, Indiana University Kelley School of Business
So far in 2020, no obstacle has proven too daunting for motivated homebuyers. Faced with a global pandemic, economic disruption, surging house prices and sparse market inventory, Indiana is nonetheless on pace for a record number of existing home sales this year. Even new single-family construction is set for its strongest year since 2007—although residential construction remains well below pre-Great Recession levels.
This uptick in construction is being driven by the unsustainably tight market for existing homes in Indiana that has led to an unprecedented rise in prices. The average of 11,400 existing homes on the market in September 2020 translates to a scant 1.5 months supply of inventory (i.e., a measure of how long it would take to exhaust the existing stock of homes on the market at the current sales rate). By comparison, the U.S. currently has an estimated 2.7 months supply (see Table 1). Six months of supply is the traditional benchmark for a balanced market.
Table 1: Indiana housing market by the numbers
| U.S. | Indiana | |
|---|---|---|
| Existing home sales, September year-to-date, year-over-year change | -0.2% | 2.4% |
| House price appreciation, 2019 Q2 to 2020 Q2 | 5.7% | 7.5% |
| Residential building permits, September year-to-date, year-over-year change | 4.1% | 5.3% |
| Foreclosure rate, 2020 Q3 | 0.6% | 0.8% |
| Months supply of inventory, September 2020 | 2.7 | 1.5 |
| Rental vacancy rate, 2020 Q2 | 5.7% | 6.2% |
Sources: Indiana Association of Realtors, National Association of Realtors, Federal Housing Finance Agency, U.S. Census Bureau and the Mortgage Bankers Association
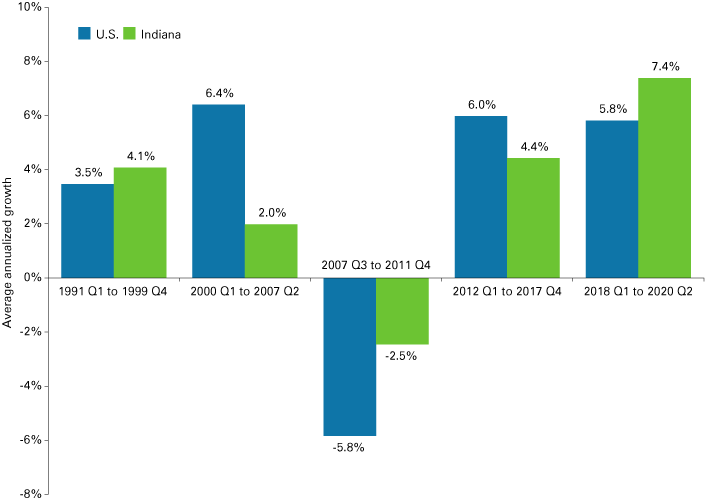
Amid this extreme sellers’ market, existing house prices in Indiana were up 7.5% year-over-year in the second quarter of 2020. This ranks as the sixth-fastest rate of growth nationally, and it is the 10th consecutive quarter that the state has seen at least a 7% annual gain. For Indiana, this represents a pace of growth over a sustained stretch that is unmatched in the last three decades (see Figure 1).
Figure 1: Average annualized growth in House Price Index over select periods
Source: Federal Housing Finance Agency, House Price Index (expanded data series, seasonally adjusted)
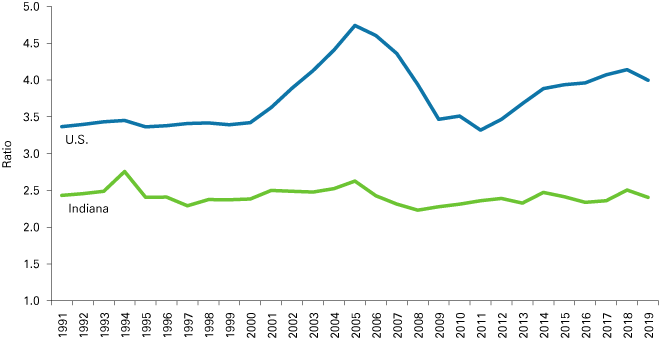
The key question is whether household incomes in Indiana can keep up with these price gains. Over the last 30 years, the ratio of median sales prices to median household incomes in Indiana has held remarkably steady—even during the bubble years and subsequent crash. Fortunately, with an average annual growth of 6.8% between 2014 and 2019, changes in the state’s median household income have kept pace with the stronger rate of house price appreciation in recent years (see Figure 2).
Figure 2: Ratio of median sales price to median household income
Source: U.S. Census Bureau, Indiana Association of Realtors and the National Association of Realtors
Short supply and rising prices would suggest the need for more new construction. Indiana has seen a relatively strong increase in housing starts, with the number of new building permits up roughly 5% year-over-year through the first three quarters of 2020. This increase has been spurred by construction for single-family units, which has improved by 10% over the same period.
Even with this boost in residential construction, new home building remains relatively low by historic standards. This point is best demonstrated by comparing new construction to existing home sales. Between 1988 and 2005, there was a fairly consistent ratio of approximately two existing home sales for each single-family building permit in Indiana (see Figure 3). In 2020, however, that ratio will likely be greater than five-to-one. This gap has begun to narrow over the last four years, but we will likely have to see the construction of more low-to-moderate priced homes to help bring balance to the market.
Figure 3: Indiana existing home sales and single-family housing permits
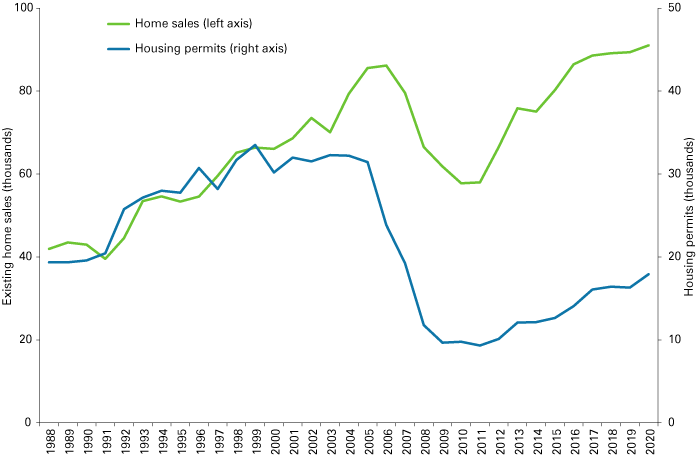
Note: The IBRC estimated the values for 2020 based on data for the first three quarters of the year.
Source: U.S. Census Bureau, Moody’s Economy.com and the Indiana Association of Realtors
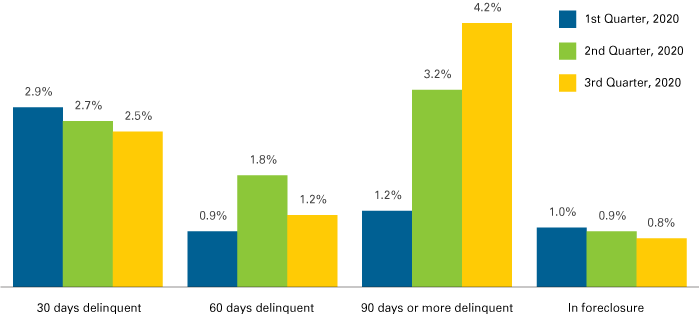
The lone housing market indicator to even hint at the hardships experienced by many in 2020 is the data on mortgage delinquencies. Indiana’s foreclosure rate remained at an exceptionally low 0.8% during the third quarter, but this measure could be distorted some by temporary foreclosure moratoriums. A deeper dive into these numbers show that the share of Hoosiers whose mortgage was at least three months past due increased more than threefold between the first and third quarters of 2020 (see Figure 4). We will have to wait on future data releases to see if Indiana’s foreclosure rate begins to climb again.
Figure 4: Indiana mortgage delinquencies in 2020
Source: National Delinquency Survey, Mortgage Bankers Association
Housing market outlook
At the national level, the consensus outlook points to a continued uptick in construction and existing home sales (see Table 2). Meanwhile, even with mortgage rates likely to remain at historically low levels, market watchers expect the pace of house price appreciation to slow significantly in 2021.
Table 2: National housing outlook
| 2020 | 2021 | Percent change | |
|---|---|---|---|
| Housing starts (thousands) | 1,349 | 1,422 | 5.4% |
| Existing home sales (thousands) | 5,463 | 5,763 | 5.5% |
| House price appreciation, annual percent change | 4.8% | 2.1% | - |
| 30-year fixed mortgage rate | 3.1% | 3.1% | - |
Note: The values in this table are an average of the projections from each organization’s October 2020 economic forecasts.
Source: Fannie Mae and Mortgage Bankers Association
Here in Indiana, with the inventory of homes on the market likely to remain low in 2021, we expect that total housing starts will continue to improve next year. Buyer demand should also remain strong, but with such tight supply, it is difficult to imagine the 2021 sales total topping what should be a record tally this year. Additionally, the rate of house price gains will continue to be higher than the state’s historic norm, but should fall short of the brisk pace set so far 2020.
Despite the trials and tribulations faced during this unprecedented year, the state’s housing market has proven to be remarkably resilient up to this point. Of course, with the COVID-19 pandemic still with us, the outlook is far more uncertain than usual. Barring a catastrophic turn on either the public health or economic fronts, however, the Indiana housing market should be set for another strong year in 2021.


