Fort Wayne forecast 2021

Director of the Community Research Institute, Purdue University Fort Wayne

Assistant Professor of Economics, Purdue University Fort Wayne
For the 2020 forecast, we advised Fort Wayne employers and workers to hope for the best and prepare for the worst due to market uncertainties—think tariffs or an economic slowdown. The uncertainty we had not considered was a worldwide outbreak of a deadly virus. A year ago, no one could predict what was coming on a pathogenic level and its economic effects.
Looking at 2020 and what’s to come in 2021, America’s economic confidence is key to Fort Wayne’s economy. With its dependence on manufacturing for both employment and gross domestic product,1 Fort Wayne’s economic vitality hinges on people purchasing goods made here.
During the state’s stay-at-home order, which ran from late March to the beginning of May, the economic effects could be directly attributed to this unprecedented closure as people adjusted their activities and spending accordingly.
Once Gov. Eric Holcomb issued the Back on Track reopening plan, starting with stage 2 on May 4, economic consequences became more diffuse. Two categories of consumers emerged: “shoppers” and “delayers.” Shoppers resumed their pre-pandemic activities, such as eating at restaurants, attending sporting events and spending (like buying vehicles, appliances and furniture). Delayers, in contrast, opted to hold on to their money out of health or economic concerns and chose to delay purchases.
Pandemic labor market and unemployment
Now that we are well into the global pandemic with no end in sight, economic trends are starting to emerge at the local level. This information largely reflects the first six months of COVID-19’s effects. While the shutdown orders came in late March,2 effects weren’t visible until the April data, save the weekly unemployment data.
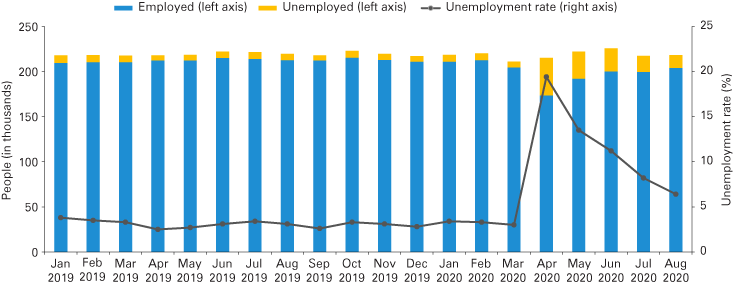
The Fort Wayne data show increases for weekly unemployment claims beginning in late March through May, followed by declines over the summer. Figure 1 shows the number of people in the Fort Wayne MSA3 from January 2019 through August 2020 who were either working (employed) or actively seeking work (unemployed) plus the unemployment rate. Like the rest of the nation, Fort Wayne’s unemployment rate spiked in April with nearly 42,000 people out of work, followed by a downward trend.
Figure 1: Fort Wayne MSA labor market data
Source: Indiana Department of Workforce Development Local Area Unemployment Statistics
What about the $600 weekly supplemental unemployment insurance (UI) payments made this spring and summer? How did that affect Fort Wayne? Excellent question, but the data aren’t yet available. That will be in the U.S. Bureau of Economic Analysis’s 2020 county-level personal income calculations scheduled for release in November 2021. While those enlarged payments felt unjust to some, especially those who continued to work in low-wage essential jobs, that economic lifeline helped recipients and kept money flowing through Fort Wayne’s economy for everything from rent and utilities to gasoline and groceries.
Anecdotal information indicate traditional UI combined with the supplemental payments, which were based on the national average wage,4 were higher than what many part-time or low-wage workers earned in their paycheck. Some employers found it difficult to fill low-wage jobs, although the July end of the payments prompted workers to return to employment, even if that pay was not as much as they were making from unemployment or their previous job.
Use of SNAP as an income measure
Since local wage data reflecting the pandemic have not been released as of October 2020, we looked at the use of the Supplemental Nutrition Assistance Program (SNAP) in Allen County as an income proxy. SNAP, often called by its former name—Food Stamps—is broadly used by low-income households to help buy food via electronic benefits transfer (EBT) cards. The Indiana Department of Family and Social Services Administration releases data monthly about the issuance amount—total value of the benefits, number of households and people receiving benefits, as well as the average household and recipient benefit.
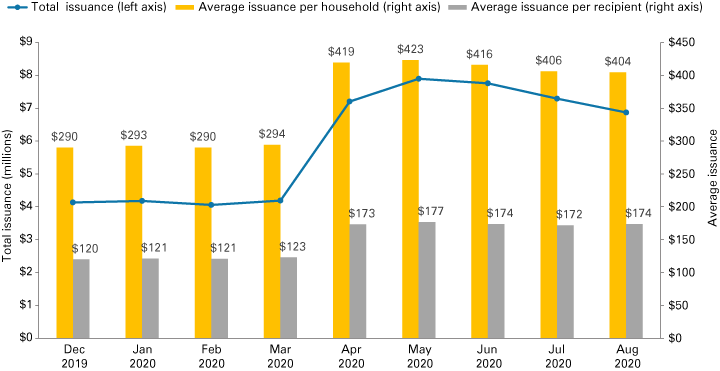
Figure 2 shows the total issuance of benefits and the average benefit by individual and household for December 2019 through August 2020 in Allen County.
Figure 2: Allen County SNAP issuance and averages
Source: Indiana Department of Family and Social Services Administration
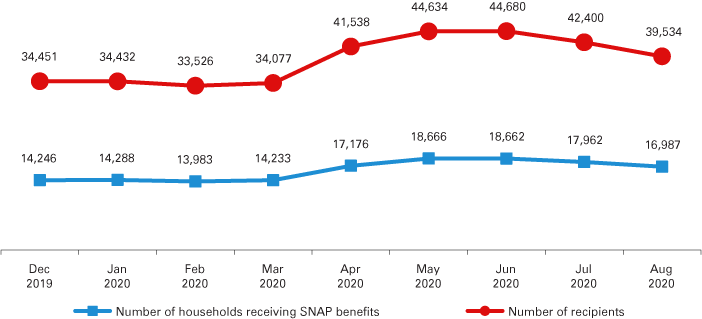
Figure 3 shows the number of households and total SNAP recipients. Mirroring unemployment, more people and households received SNAP benefits in the spring, with a slow but persistent decline over the summer.
Figure 3: Number of Allen County SNAP households and recipients
Source: Indiana Department of Family and Social Services Administration
What’s ahead for unemployment
Our unemployment forecasts focus on three sectors of the Fort Wayne MSA economy that have been hit the hardest: manufacturing; retail trade; and accommodation and food services. To capture the overall movement of unemployment, we also examine total claims, which reflects all industries using data from the Indiana Department of Workforce Development.
The original data frequency is weekly for Jan. 5, 2008, through Oct. 3, 2020.5 Weekly claims are converted to monthly data for a total of 151 observations since there are missing observations for December 2019, January 2020 and March 2020.6
To study the future movement of Fort Wayne’s unemployment, we utilize impulse response functions (IRFs).7 The IRFs give us the movement, i.e., response of a variable if another variable experiences a shock.8 Unemployment in one industry can affect unemployment in other industries due to the interconnectedness of the economy. For instance, if manufacturing’s unemployment increases, these workers have less money to spend at stores, leading to an increase in retail unemployment.
The forecasts assume ceteris paribus (i.e., keeping all factors constant), such as no additional expansionary fiscal stimulus, no further shutdowns, or no major significant change in the pandemic infection rates.
If the IRF value is positive, this means that unemployment is increasing. The following charts reflect November 2020 to December 2021.
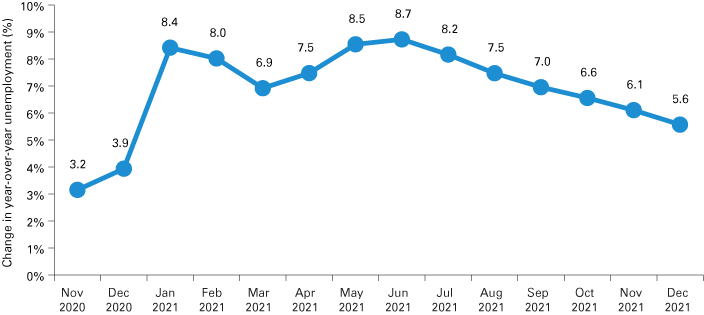
We examine the effects of a shock to total claims on the model’s variables, shown in Figure 4 through Figure 7, as measured by percentage increase. Regarding unemployment in accommodation and food services, we expect an increase of 8.4% in January 2021 with the peak growth occurring in June 2021. In level terms, we expect a total of 1,161 people unemployed in accommodation and food services in January 2021.
Figure 4: Response of accommodation and food services to shocks in total claims
Source: Authors' calculations, using Indiana Department of Workforce Development data
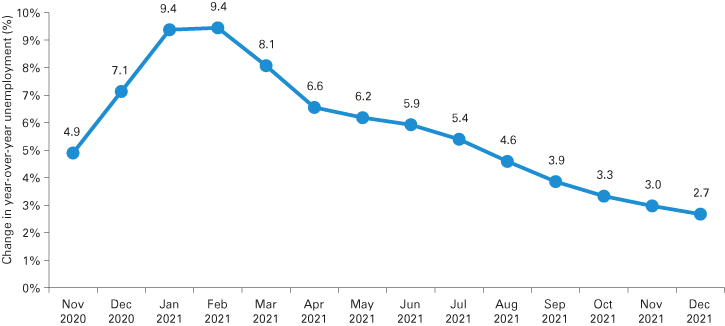
The response of retail trade shows a peak increase of 9.4% in February 2021. This translates into 866 people unemployed in retail trade in February 2021. There is a gradual decline, and the growth rate of unemployment in retail trade increases by 2.7% in December 2021.
Figure 5: Response of retail trade to shocks in total claims
Source: Authors' calculations, using Indiana Department of Workforce Development data
Manufacturing shows the largest response to a total claims shock. The growth rate is expected to be a 30% increase in November 2020, but then it declines to about 1.3% in December 2021. In October 2020, there were 1,777 people unemployed in manufacturing. If unemployment increases by 30% in November 2020, then there should be an additional 535 unemployed manufacturing workers.
Figure 6: Response of manufacturing to shocks in total claims

Source: Authors' calculations, using Indiana Department of Workforce Development data
If total claims experience a shock, it should grow by 14.3% in November 2020, with an increase of 1,045 more people unemployed, which is the peak increase. Then, it declines to 2.2% by December 2021.
Figure 7: Response of total claims to shocks in total claims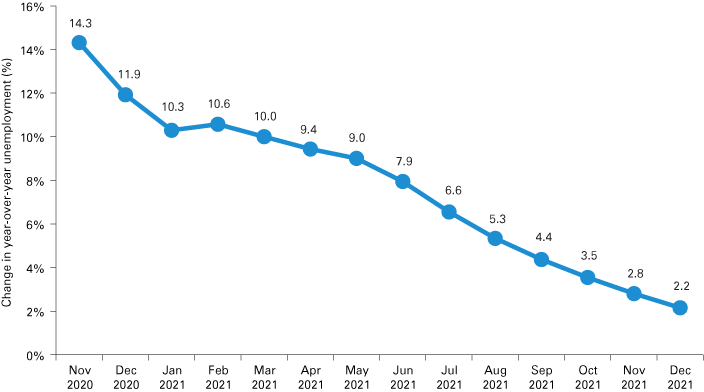
Source: Authors' calculations, using Indiana Department of Workforce Development data
We want to see negative numbers in the above charts, which would reflect fewer unemployed people, but unfortunately the models show unemployment increasing across all sectors until the end of 2021.
Conclusion
Looking to what 2021 holds for Fort Wayne’s labor market and economic health, the only certainty is uncertainty. While economic predictions can never be guaranteed, next year looks unclear for Fort Wayne, especially without key 2020 data to help us better understand the pandemic’s effects.
Assuming that President-elect Joe Biden is consistent with President Barack Obama’s manufacturing policy, we do not expect a Biden administration to be hostile to American manufacturing, especially since key swing states are part of the industrial Midwest. Exact policy priorities are not yet known.
Another question mark remains about additional stimulus. Local data reflecting the spring stimulus payment are not available, but extra cash in the pockets of Fort Wayne residents should have positive economic effects.
As for the pandemic’s effects, we expect Fort Wayne to mirror other midsize Midwestern cities. It is reasonable to anticipate people who were delaying purchases return to the market as the pandemic wears on if their financial position remains steady. Those who lose work or pay are likely to scale back. An effective vaccine with sufficient administration could put this public health threat behind us in 2021, but Dr. Anthony Fauci is cautioning that we may not assume a post-pandemic life until 2022.9
In sum, 2020 leaves us with more questions than answers about 2021. The unknown priorities of the federal government combined with the economic and public health threats from COVID-19 mean economic contraction could define the year, or Fort Wayne could return to full-throttle employment and a healthy economy. It’s anyone’s guess.
Notes
- In March 2020, manufacturing had 36,772 workers in the Fort Wayne MSA, putting it at twice the concentration of manufacturing employees as compared to the nation as a whole, according to the U.S. Department of Labor’s Quarterly Census of Employment and Wages. Manufacturing made up approximately 18.7% of the 2018 Fort Wayne MSA gross domestic product, according to Purdue University Fort Wayne’s Community Research Institute’s calculations, using data from the U.S. Bureau of Economic Analysis.
- Gov. Eric Holcomb ordered public and private schools to close March 19, 2020 (via Executive Order 20-05), ceased in-person dining and bar operations on March 16, 2020 (Executive Order 20-04), and issued his initial Hunker Down Hoosiers stay-at-home order effective March 25, 2020 (Executive Order 20-08).
- While the federal Office of Management and Budget removed Wells County in the Fort Wayne MSA in 2018, the Indiana Department of Workforce Development is continuing to use the three-county MSA.
- See Koeze, E. (2020, April 23). The $600 Unemployment booster shot, state by state. New York Times. Retrieved from www.nytimes.com/interactive/2020/04/23/business/economy/unemployment-benefits-stimulus-coronavirus.html
- For data with less than 10 observations but greater than zero, the Indiana Department of Workforce Development denotes this as (D). These observations are assigned the average value of 5 in order to avoid a missing value issue.
- All unemployment forecasting is done using EViews 11.
- To generate the IRFs, a four-equation vector autoregressive (VAR) model is used, which is comprised of the year-over-year (YoY) monthly growth rates of initial and continued unemployment claims in accommodation and food services, retail trade, manufacturing, and total claims. In order to mitigate any unit root issues as well as potential seasonality, the year-over-year (YoY) growth rates using the natural log of the data is used. The inspiration for our unemployment forecasts came from Anderson, Caggiano, Vahid and Wong (2020), which examine employment patterns in the Australian economy during the COVID-19 pandemic. Anderson, Caggiano, Vahid and Wong (2020) treat their version of total claims as exogenous, but they do note that it is not strictly exogenous since it is comprised of the other variables in their model. See Anderson, H., Caggiano, G., Vahid, F., & Wong, B. (2020). Sectoral employment dynamics in Australia, CAMA Working Paper No. 51/2020. Pesaran and Shin’s (1998) generalized impulse response functions (IRFs) are used since the order of the VAR will not have an effect on the estimation results. See Pesaran, M., & Shin, Y. (1998). Generalized impulse response analysis in linear multivariate models, Economics Letters, 58(1), 17-29.
- Figures 4 to 7 show the IRFs of a one-standard deviation shock to total claims.
- Lin, R.-G., II. (2020, October 29). ‘Normal’ unlikely to come before 2022 as COVID-19 surges unchecked, Fauci says. Los Angeles Times. Retrieved from www.latimes.com/california/story/2020-10-29/normal-unlikely-before-2022-covid-19-surge-fauci


