Financial markets in 2021: Recovery to a new normal?

Associate Professor of Finance, Kelley School of Business, Indianapolis

Edward E. Edwards Professor of Finance, Kelley School of Business, Bloomington
Last year’s financial forecast for 2020 focused on the likely effects of trade policy uncertainty and weak business investment, but the world changed completely following the World Health Organization’s Jan. 5, 2020, announcement of a “pneumonia of unknown causes” in China.1 As reports of the global spread of the new COVID-19 virus increased over the next six weeks, financial markets began to price in expectations of a pandemic and its economic consequences. Between mid-February and the mid-March beginning of government-imposed restrictions on mobility and business activity, the S&P 500 index fell by over 30%, the U.S. 10-year Treasury yield fell below 1%, and measures of volatility reached levels not seen since the global financial crisis. Yet, despite a historic drop in employment and economic activity, the S&P 500 index began to reverse course in late March, and by September had reached a new high. What do these financial market trends from 2020 suggest for 2021?
As we look to 2021, we must first understand three unusual factors dominating financial markets in 2020:
1. Differential sector impacts of the COVID-19 pandemic
Stock prices reflect a stream of expected future earnings discounted by a factor reflecting the risk of those earnings, and so they represent a forecast of future company performance. However, a closer examination of stock index trends reveals a tale of two markets: one based upon firms which are positioned to use technology and communication platforms to grow their business in the midst of pandemic restrictions and changes in customer behavior, and one based on firms challenged in adapting to the new environment. Information technology and communication services sectors now carry nearly a 40% weight in the S&P 500 index, so changes in the values of companies in these sectors have a large influence on the overall market return.2
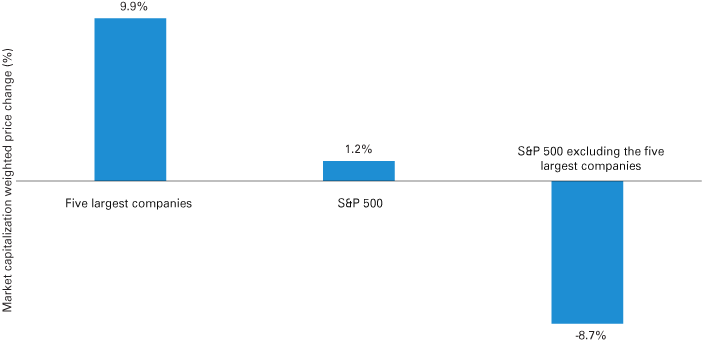
Furthermore, Figure 1 shows that just five stocks—Apple, Microsoft, Amazon, Facebook and Alphabet (Google)—represent nearly 25% of the S&P 500’s value and have dominated S&P 500 index gains in 2020. In fact, although the S&P 500 gained over 1% between January and the end of October, absent these five stocks the S&P 500 index would have actually fallen by over 8%.
Figure 1: Percent change in S&P 500 vs. weighted percent price changes of five largest companies (Apple, Microsoft, Amazon, Facebook, Alphabet), January to October 2020

Source: Price data for the five stocks and the S&P 500 were obtained from Yahoo Finance, https://finance.yahoo.com/, accessed on Nov. 1, 2020. Market weights for Apple, Microsoft, Amazon, Facebook and Alphabet as of Oct. 30, 2020, were obtained from the SPY ETF, which tracks the S&P 500. The calculation was based upon these weights and the percentage changes in the adjusted stock prices from Jan. 2 to Oct. 30, 2020.
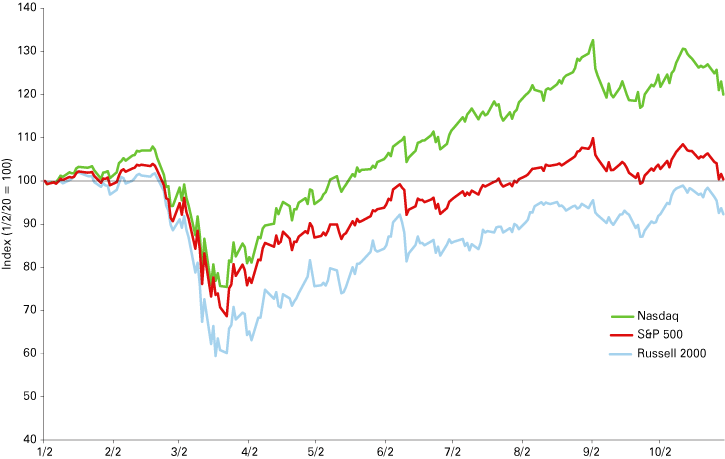
Differences in company performance this year are also highlighted in Figure 2, which shows the Russell 2000 index of smaller U.S. firms down by 7% at the end of October relative to the start of 2020, compared with the technology-heavy Nasdaq composite index’s 20% gain over the same period.
Figure 2: Year-to-date changes in U.S. stock market indices, January to October 2020

Source: Daily adjusted closing price index data for Jan. 2 to Oct. 30, 2020, accessed on Nov. 1, 2020. S&P 500 Index: https://finance.yahoo.com/quote/%5EGSPC?p=%5EGSPC; Nasdaq Composite Index: https://finance.yahoo.com/quote/%5EIXIC?p=%5EIXIC; and Russell 2000 Index: https://finance.yahoo.com/quote/%5ERUT?p=%5ERUT
2. Extraordinary monetary and fiscal stimulus measures
In response to heightened financial market stress and concerns about the lockdown’s impact on business and household incomes, policymakers quickly assembled a series of financial support measures in March. The Federal Reserve slashed its federal funds rate target to near 0%, and on March 23 announced that it would begin significant asset purchases and create credit facilities to support the flow of credit and smooth market functioning.3 The result was the Federal Reserve’s purchase of nearly $3 trillion in assets by the end of May. This amount is more than double the amount purchased during the height of the 2008 financial crisis, and it represents a 70% expansion of the Federal Reserve’s asset holdings.4
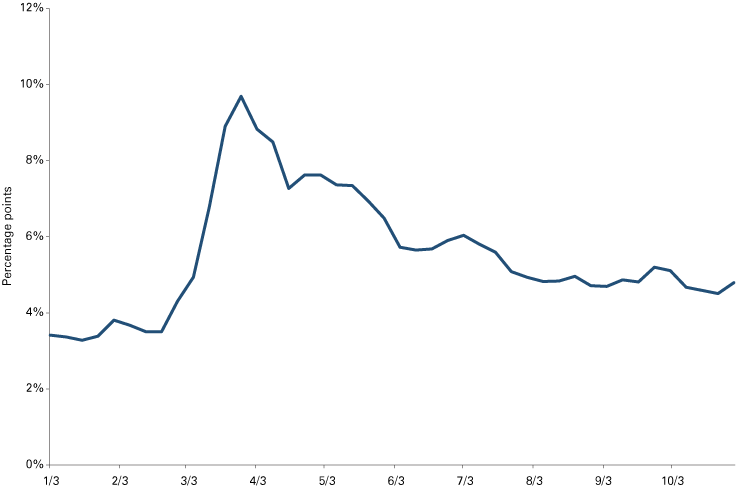
Another notable feature of this year’s Federal Reserve stimulus was the expansion of the types of bonds purchased. In addition to the Treasury bills and bonds and mortgage-backed securities it had purchased in the past, the Fed opened the door to purchases of other kinds of assets—including asset-backed securities, corporate and municipal bonds, and commercial paper. Further, the Federal Reserve created the Main Street Lending Program to provide lending to small and medium-sized businesses and nonprofit organizations. As shown in Figure 3, this level of Federal Reserve support eased credit risk premiums reflected in the difference between the yield on corporate bonds with lower credit ratings and the U.S. 10-year Treasury bond yield. This stimulus has also contributed to the rise in stock prices by supporting company earnings while also lowering the discount rate at which those future cash flows were valued.
Figure 3: Credit spread for high-yield corporate bonds, January to October 2020

Note: This chart shows the difference between the High Yield Index effective yield less the yield on the U.S. 10-year constant maturity Treasury bond rate from Jan. 3 to Oct. 30, 2020.
Source: Ice Data Indices, LLC, ICE BofA US High Yield Index Effective Yield [BAMLH0A0HYM2EY] (https://fred.stlouisfed.org/series/BAMLH0A0HYM2EY) and Board of Governors of the Federal Reserve System, 10-Year Treasury Constant Maturity Rate [DGS10] (https://fred.stlouisfed.org/series/DGS10), both retrieved on November 3, 2020, from FRED, Federal Reserve Bank of St. Louis
The U.S. government added to the historic actions by passing the $2.2 trillion CARES Act on March 27, followed by additional legislation that added nearly $3 trillion in additional government spending to the U.S. economy. The sharp rise in spending increased the fiscal budget deficit from 4.5% to 15.2% of GDP—the largest deficit as a share of GDP since 1945.5 The need to finance such spending with government borrowing has added to the country’s overall level of government debt outstanding.
3. Uncertainty about the trajectory of the recovery
The greater volatility of stock market indices reflects continued uncertainty about the spread of COVID-19, the promise of medical innovations to contain the virus and the continued effects of the pandemic on the economy. After falling in July and August, the number of COVID-19 cases has been rising since September, causing concerns about the re-imposition of restrictions that would impact future earnings. Further, many companies are trying to assess the possibility of changes in taxes, regulations and the chances of additional fiscal stimulus as a result of the elections.6 These uncertainties contributed to stock market volatility in the months leading up to the November election.
The outlook for 2021
We expect the three factors mentioned above will continue to be relevant to financial markets as we enter 2021. How stock values ultimately respond will depend upon the strength of these influences, as well as upon other factors impacting market values. Below we provide our views as to what some of these positive and negative influences could be.
Positive developments for stock returns
-
The Q3 rebound in real GDP: After falling by an annualized 31% in the second quarter, the economy has experienced an annualized rebound of 33% in the third quarter of 2020. Added to the report’s overall GDP good news was the rebound in the consumption of both services and goods and a rise in business fixed investment, with the latter being an important requirement for future GDP growth and positive stock earnings. Although real GDP growth rates reflect only past economic activity, this sharp rebound suggests an underlying resiliency of the U.S. economy in the face of the global pandemic, which bodes well for future growth.
-
Positive S&P 500 earnings surprises and earnings forecasts: Although the blended S&P 500 company year-over-year earnings declined 7.5% in the third quarter of 2020, earnings announcements have revealed that the drop in earnings was not as deep as originally expected. Of the 89% of S&P 500 companies reporting third quarter earnings, 86% reported positive earnings surprises, including companies in the industrial and energy sectors (which had experienced the greatest losses). While the earnings surprises reflect to some extent the very cautious earnings guidance provided by companies, these surprises may also reflect the ability of companies to adjust and innovate in response to the new business environment. Consistent with this adjustment, analysts are expecting that S&P 500 company earnings will grow in 2021.7
-
Low interest rates will continue: The Federal Reserve has indicated its intent to keep interest rates low and around current levels through 2021 and possibly until 2023. At the end of October, the 10-year Treasury bond rate stood at 0.85%, higher than its 0.5% low, but well below its 2.3% average since 2010. The three-month Treasury bill has been just above 0%. Mortgage interest rates have also fallen to new lows, with the average 30-year fixed rate mortgage now below 3%. Such low mortgage rates will continue to boost home purchases and the consumer spending associated with home ownership. Lower interest rates also allow companies to refinance their existing debt obligations into lower cost choices and to borrow for new investments. Lastly, a continuation of the Federal Reserve’s corporate bond purchases will help lower the level and the volatility of the credit risk component of business financing costs.
-
Resiliency and flexibility of businesses: Companies go public when they have confidence in their future prospects, and initial public offering (IPO) activity surged in the third quarter of 2020, with 165 companies listing on U.S. exchanges with gross proceeds of $61 billion—the largest amount raised in a single quarter in the last decade. When these numbers are added to second quarter listings, IPOs are on track for a record-setting year.8 In addition, the U.S. Census Bureau reports that new business applications are up nearly 38% since the start of the year, well above past increases.9 A continuation of such activity into early 2021 will be further evidence of the resiliency of U.S. businesses and be a positive influence on stock values.
-
Near-term inflation risks are low: While estimates of inflation were elevated in the late spring and early summer following the Federal Reserve’s stimulus actions and its August announcement of the loosening of its inflation target, expectations have since moderated to levels observed in the past two years.10 The actual percent change in the Personal Consumption Expenditures Price Index (PCE), the price index most closely monitored by the Federal Reserve, has remained below 2% throughout 2020. Lower inflation risk will help companies contain costs, boost earnings and also help interest rates to remain low.
- Acceleration in the development and distribution of COVID-19 vaccines: Future business activity and the return to some resemblance of normality depends on the availability of a COVID-19 vaccine. While the likelihood of a vaccine is being priced into stocks, an unexpected breakthrough in the availability of vaccines could broadly boost stock prices.
Downside risks
-
A prolonged pandemic: A major risk to stock returns will be the economic impact of curbs to business activity and hence to company earnings if the pandemic lasts longer than expected. We have seen a rise in COVID-19 cases in the fall resulting in renewed restrictions on businesses in some parts of the country, along with public health warnings for consumers to stay at home. Although recent breakthroughs in vaccine development further hopes that these restrictions will be temporary, uncertainty about the speed of the distribution of the vaccine remain. The CBOE’s Volatility Index (VIX), a market-based forward-looking estimate of expected stock market volatility, continues to reflect that uncertainty with levels which remain elevated relative to its 2019 average of 15.11 Heightened risk arising from an unexpected setback in the availability of the vaccine could cause stocks to return some of the gains obtained in 2020 as investors reassess future company earnings.
-
Elevated price/earnings (P/E) ratios: The forward 12-month P/E for the S&P 500 is around 21.6 as of Nov. 6, a value which is above the five-year average of 17.12 High valuations are also reflected in Robert Shiller’s cyclically adjusted P/E ratio (known as the “CAPE”), with a CAPE value equal to about 30, well above its long-term mean of 17 and second only to the value during the global financial crisis.13 Absent a fundamental change in the expectation for P/E ratios under the new normal, these ratios would be expected to return to average levels in one of two ways: through a rise in earnings or through a fall in price. If future earnings fail to match valuations, then stock prices can fall.
-
Credit and interest rate risks: The broadening of the Federal Reserve’s asset purchases and low interest rates have certainly helped support economic activity during the pandemic. However, continued support could raise the likelihood that companies and institutions will take investment risks that otherwise would be viewed as unprofitable and lead to higher credit risks. Higher credit risk premiums would in turn increase borrowing costs for companies and reduce earnings, putting firms at risk for default.14 Further, the historically low interest rate environment means fixed-income portfolios weighted toward long-term bonds face increased interest rate risk in the unlikely event that the Federal Reserve decides to raise rates sooner than predicted.
-
International risks: With the international revenue exposure of S&P 500 companies at 40%, U.S. companies will be impacted by the growth prospects of U.S. trading partners. The International Monetary Fund’s recent October world economic outlook forecasts positive growth in global economies in 2021, but uncertainty and concern about the resurgence in COVID-19 cases globally and risks of renewed restrictions on business activity could adversely impact stock values.
-
The U.S. fiscal position: In 2020, the annual U.S. fiscal deficit as a share of GDP tripled compared to its level one year ago. At over 15% of GDP, this represents the largest deficit percentage since 1945 and has required a significant increase in government borrowing. The total amount of federal debt held by the public as a percent of GDP breached 100% for the first time in U.S. history, and the interest payments on that debt will contribute further to government borrowing needs. While this increase in the debt ratio is not expected to raise interest rates in the near term, excessive issuance could eventually raise the credit risk premium on U.S. Treasury bonds.
Forecast
Standard financial forecasting models do not have placeholders for the differential impacts of COVID-19 on industry sectors, the extraordinary monetary and fiscal interventions, or the different trajectories of the pandemic and vaccine developments, making any numerical forecast difficult. We believe prospects for stock returns in 2021 are highly dependent on the speed of the development and distribution of a COVID-19 vaccine, and on the ability of companies to continue to adjust to the new ways of doing business rather than wait for the return of the old business. We also believe that the ability to adapt will continue to be reflected in diverse performance across business sectors.
In assessing the various factors that could impact equity performance, we remain optimistic for three reasons. First, a successful vaccine plus therapeutic treatments may eventually allow us to coexist with the virus, and the adaptability and innovation of businesses may mitigate the effects of future shutdowns even before a vaccine is available. Second, the very low interest rate environment combined with sizable Federal Reserve asset purchases suggest that higher-than-average equity valuations and suppressed credit risk premiums are likely to continue in 2021. Finally, the election’s outcome suggesting a divided government reduces the likelihood of a major overhaul of either the regulatory or tax structures in 2021. All three reasons could help businesses move the economy and markets forward toward a new normal even without a major fiscal stimulus package. As a result, we expect equity returns will be positive, though volatile, in 2021.
Notes
- World Health Organization, “Pneumonia of unknown cause—China,” January 5, 2020, www.who.int/csr/don/05-january-2020-pneumonia-of-unkown-cause-china/en/
- As of October 30, 2020. The sector breakdown of the S&P 500 can be found at “S&P 500 Sector Breakdown,” S&P Dow Jones Indices, www.spglobal.com/spdji/en/indices/equity/sp-500/#data
- Federal Reserve, “Federal Reserve announces extensive new measures to support the economy,” Board of Governors of the Federal Reserve System, March 23, 2020, www.federalreserve.gov/newsevents/pressreleases/monetary20200323b.htm
- “Credit and Liquidity Programs and the Balance Sheet,” Board of Governors of the Federal Reserve System, October 30, 2020, www.federalreserve.gov/monetarypolicy/bst_recenttrends.htm, and “Report on the Federal Reserve’s balance sheet: August 2020,” Board of Governors of the Federal Reserve System, August 2020, www.federalreserve.gov/publications/files/balance_sheet_developments_report_202008.pdf.pdf
- Fiscal policy responses are described in the International Monetary Fund’s “Policy Responses to Covid-19”, as of October 24, 2020, www.imf.org/en/Topics/imf-and-covid19/Policy-Responses-to-COVID-19#U. The U.S. fiscal deficit is the estimate from the Congressional Budget Office’s “Monthly Budget Review for September 2020,” October 8, 2020, www.cbo.gov/system/files/2020-10/56661-MBR.pdf
- John Butters, “More than one third of S&P 500 companies are discussing the election on Q3 earnings calls,” FactSet Insight, November 2, 2020, https://insight.factset.com/more-than-one-third-of-sp-500-companies-are-discussing-the-election-on-q3-earnings-calls
- John Butters, “S&P 500 earnings season update: November 6, 2020,” FactSet Insight, November 6, 2020, https://insight.factset.com/sp-500-earnings-season-update-november-6-2020
- Sara B. Potter, “U.S. IPO Market: SPACs drive a third quarter IPO surge,” FactSet Insight, October 8, 2020, https://insight.factset.com/u.s.-ipo-market-spacs-drive-a-third-quarter-ipo-surge
- See Business Formation Statistics from the U.S. Census Bureau at www.census.gov/econ/bfs/index.html.
- See University of Michigan: Inflation Expectation [MICH] (https://fred.stlouisfed.org/series/MICH) and the 10-year breakeven inflation rate (https://fred.stlouisfed.org/series/T10YIE), both retrieved on November 2, 2020, from FRED, Federal Reserve Bank of St. Louis.
- Chicago Board Options Exchange, CBOE Volatility Index: VIX [VIXCLS], retrieved on November 2, 2020, from FRED, Federal Reserve Bank of St. Louis, https://fred.stlouisfed.org/series/VIXCLS
- See note 7.
- “Shiller PE ratio,” Multipl.com, www.multpl.com/shiller-pe
- The number of downgrades has risen in 2020, with S&P Global forecasting a possible doubling of default rates in the U.S. by June 2021. See Marc Jones, “S&P global sees U.S. and European corporate default rates doubling,” Reuters, Oct. 6, 2020, www.reuters.com/article/global-ratings-s-p/sp-global-sees-u-s-european-corporate-default-rates-doubling-idUSKBN26R2GJ


