Indianapolis-Carmel forecast 2020

Clinical Assistant Professor of Business Economics, Kelley School of Business, Indiana University
The Indianapolis-Carmel-Anderson economy continues to experience steady economic growth since the Great Recession ended. Unemployment is quite low and job growth is steady. However, leading indicators suggest that 2020 will be a year of slower growth.
Employment and wages
The labor market in the Indianapolis market continues to perform very well for workers. Unemployment is hovering around 3 percent and is likely to remain low throughout 2020.
Wage growth remains a challenge for workers in the area. Through the first quarter of 2019, average weekly wages increased at a rate of 1.2 percent over the prior year, barely keeping up with inflation. Later in 2019, wages seem to be rising more quickly, but time will tell whether these wage gains will remain. If the economic growth can remain steady through 2020, wages will certainly see upward pressure. This is a welcome trend for workers, and is probably good for the economy as a whole—but it leads to managerial challenges and lower profit margins for businesses.
Demographic shifts
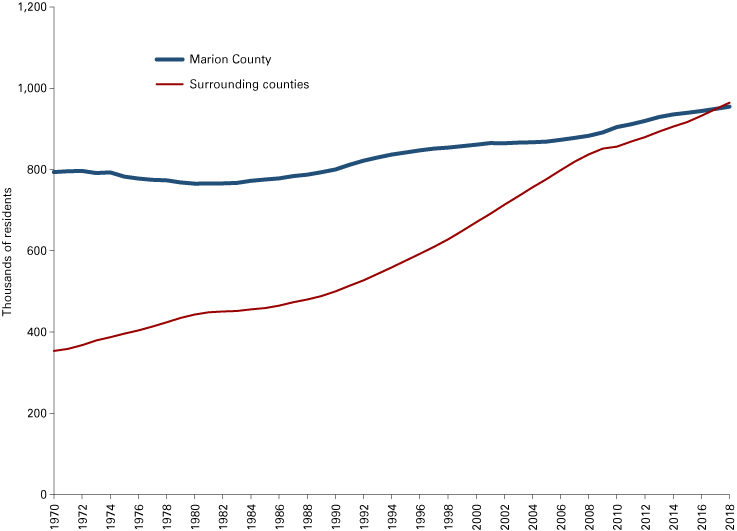
Population growth has focused on the surrounding counties over the last number of years, and 2018 marked a significant milestone. The population of the nine surrounding suburban counties in the MSA—excluding Madison County (Anderson)—now exceeds that of Marion County (see Figure 1). The population growth rate in Marion County is steady at 1.1 percent per year, while the surrounding counties are growing at 1.7 percent per year. Both numbers compare favorably to a statewide population growth rate of 0.5 percent per year.
Figure 1: Growth in the resident population for Indianapolis and surrounding counties

Note: The surrounding counties include Boone, Brown, Hamilton, Hancock, Hendricks, Johnson, Morgan, Putnam and Shelby.
Source: U.S. Census Bureau
The Indianapolis metropolitan area is drawing in people from other parts of the state, helping spur greater economic growth.
Employment sectors
Bright spots in employment sectors include construction, transportation and warehousing, and wholesale trade.
Manufacturing jobs were strong in the early part of 2019, with growth of 3.1 percent (see Table 1). However, weakness in output indicates that this number will likely turn negative in 2020. Manufacturing plays a large role in the employment picture due to both the size of the sector and the relatively higher wages.
Table 1: Quarterly wage report for the Indianapolis metro, 2019 Q1
| Industry | Total jobs | Percent change in jobs | Average weekly wage | Percent change in average weekly wage |
|---|---|---|---|---|
| Total | 1,011,393 | 1.9% | $1,096 | 1.2% |
| Health care and social services | 152,108 | 1.3% | $1,088 | 3.7% |
| Retail trade | 100,963 | -0.6% | $591 | 2.2% |
| Manufacturing | 93,827 | 3.1% | $2,074 | 2.8% |
| Accommodation and food services | 93,111 | 2.3% | $353 | 1.7% |
| Administrative, support, waste management and remediation | 80,605 | -1.2% | $671 | 0.6% |
| Transportation and warehousing | 74,832 | 4.0% | $891 | 2.8% |
| Educational services | 73,331 | 3.1% | $875 | 0.1% |
| Professional, scientific and technical | 58,222 | 1.8% | $1,523 | -0.6% |
| Construction | 48,902 | 7.1% | $1,162 | 2.0% |
| Finance and insurance | 47,542 | 1.7% | $1,933 | -3.9% |
| Public administration | 45,513 | 1.3% | $1,086 | 1.9% |
| Wholesale trade | 44,632 | 3.9% | $1,486 | -2.2% |
| Other services | 31,659 | 2.5% | $729 | 2.4% |
Source: Quarterly Census of Employment and Wages data from the Indiana Department of Workforce Development
Housing and construction
Housing prices continue to rise in Central Indiana, with the average selling price going up by 6.2 percent over the four quarters. This reflects two trends of more building of higher-end housing and general residential inflation.
Residential building permits are a key indicator of growth in housing in the area. Building permits have declined by 1.1 percent over the last year, serving as another indicator of a potential slowdown in economic activity. Two factors could lead to a slowdown in the housing market. Consumer confidence is slowing due to general economic conditions, which could make builders reluctant to increase production. This factor is coupled with low unemployment in the construction area. However, low mortgage rates will keep enticing new homeowners into the market.
The good and the bad
The Indianapolis metro area has some great features that will lead to growth. It was recently ranked seventh in the country in terms of affordability. The Indianapolis Airport consistently ranks among the top in the nation. Indianapolis continues to invest in tourism and convention capabilities, which draw in over 28 million visitors per year.
However, the area’s infrastructure is lagging in other areas. Indianapolis recently ranked last out of 100 U.S. cities in terms of overall public transportation.1 Initiatives such as the recently opened Red Line are a step in the direction of improvement, but larger investments will be necessary to make Indianapolis competitive.
Forecast
The Indianapolis area economy continues to grow, although that growth appears to be slowing. The Federal Reserve creates an Economic Conditions Index for the Indianapolis-Carmel-Anderson MSA, which shows 1.5 percent to 2.0 percent growth over the next year.2 This is consistent with other economic data and models.
On the positive side, Indianapolis continues to draw in talent and investment that should help it exceed the overall state level of growth. However, there is risk that weakness in the broader economy—and especially weakness in manufacturing—could make this forecast too optimistic. Given the election coming at the end of 2020, consumers and managers should be aware that the coming year could be quite volatile economically.
Notes
- Adam McCann, “Cities with the Best & Worst Public Transportation,” WalletHub, September 10, 2019, https://wallethub.com/edu/cities-with-the-best-worst-public-transportation/65028/.
- Federal Reserve Bank of St. Louis, “Economic Conditions Index for Indianapolis-Carmel-Anderson, IN (MSA) [INDAGRIDX],” FRED: Federal Reserve Bank of St. Louis, https://fred.stlouisfed.org/series/INDAGRIDX.


