
Strong demand, scant supply in Indiana housing market
Senior Demographic Analyst, Indiana Business Research Center, Indiana University Kelley School of Business
Indiana’s housing market continues to be marked by a dramatic imbalance between strong demand and scant supply. Hoosiers purchased a record number of existing homes in 2017, with total sales up 2.4 percent over the previous year (see Table 1). Meanwhile, the average monthly inventory of homes on the market in 2017 was nearly 14 percent lower than in 2016 (which itself was down 15 percent over the previous year).
Table 1: Indiana housing market by the numbers
| U.S. | Indiana | |
|---|---|---|
| Existing-home sales, 2016-2017 percent change | 1.1% | 2.4% |
| House price appreciation, 2016 Q4 to 2017 Q4 | 7.0% | 6.6% |
| Residential building permits (number of units), 2016 -2017 percent change | 6.2% | 15.8% |
| Foreclosure rate, 2017 Q4 | 1.2% | 1.4% |
| Months supply of inventory, 2017 average | 4.4 | 3.8 |
| Rental vacancy rate, 2018 Q1 | 7.0% | 8.5% |
Source: Indiana Association of Realtors, National Association of Realtors, Federal Housing Finance Agency, U.S. Census Bureau and the Mortgage Bankers Association
These tight market conditions are fueling a surge in home prices. Existing-house prices in Indiana were up 6.6 percent year-over-year at the end of 2017—the state’s largest annual increase on record dating back to 1991. While a boon to those looking to sell their homes, rising prices—coupled with declining rental vacancy rates and the expectation of rising mortgage interest rates—could begin to impact housing affordability for some in the state.
Not surprisingly, rising prices and short supply have paved the way for a relatively strong increase in new construction. The number of new residential building permits issued in Indiana increased nearly 16 percent in 2017. While this marks a significant improvement, residential construction remains slow by historic standards. The number of permits issued for new single-family homes last year, for instance, is still only half as large as the average annual number of permits issued between 1998 and 2005.
This article examines the latest data to gauge the state of Indiana’s housing market. First, we present a detailed overview of market conditions with a focus on home sales, prices and foreclosures. Later, we check in on the demographic drivers of the housing market and look at trends in residential construction.
Existing-home market continues to heat up
With low interest rates for much of the year, a strengthening economy and still relatively low levels of residential construction in 2017, the conditions were set for another strong year for existing-home sales in Indiana. The state tallied more than 88,500 existing-home sales last year—a new record for Indiana (see Table 2).
Table 2: Indiana existing-home sales
| 2010 | 2011 | 2012 | 2013 | 2014 | 2015 | 2016 | 2017 | |
|---|---|---|---|---|---|---|---|---|
| Existing-home sales | 57,942 | 58,334 | 66,871 | 76,257 | 75,055 | 80,244 | 86,043 | 88,566 |
| Annual percent change | -6.3% | 0.7% | 14.6% | 14.0% | -1.6% | 6.9% | 7.2% | 2.9% |
Source: Indiana Association of Realtors
With the exception of a brief lull in 2014, Indiana’s existing-home market has been on the rebound since its low point in the middle of 2011, when the state registered only 53,600 existing-home sales over the previous 12-month period (see Figure 1). Comparing this trough to the current peak, the number of existing-home sales in Indiana has increased 65 percent over the past six years.
Figure 1: Indiana home sales, moving four-quarter total
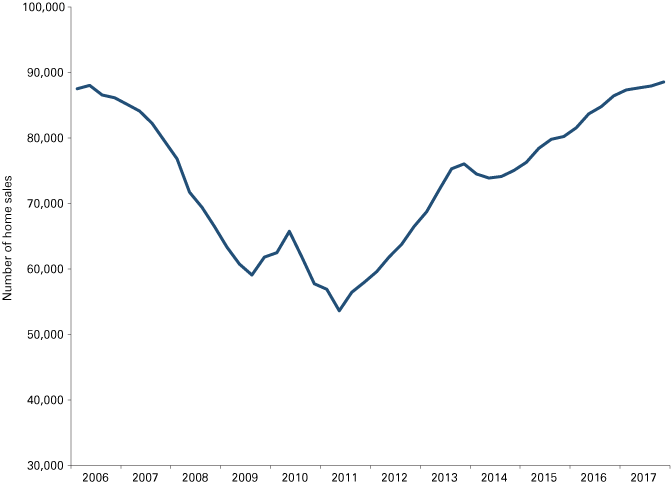
Source: Indiana Association of Realtors
The rise in demand in recent years has also sparked a steady increase in home prices. At nearly $147,000 last year, the median sales price for existing homes increased by 5.7 percent in 2017—the sixth consecutive year with median price gains of at least 3 percent.
The sharp climb in prices over the last five years has been driven in large part by a shrinking inventory of existing homes for sale. In 2017, Indiana’s average monthly inventory was roughly 27,970 existing homes on the market. To put this number in context, Indiana’s inventory in 2017 was down nearly 14 percent from the previous year and was 60 percent lower than the highest average annual mark on record in 2007.
The decline in inventory, coupled with strong buyer demand, has led to a sharp drop in the estimated months supply of existing homes for sale in Indiana. The months supply measure is an estimate of how long it would take to work through the inventory of homes for sale in a given month at the average monthly sales rate over the previous year. As one would expect, there is a strong negative relationship between months supply and prices (correlation = -0.97), with prices increasing as supply began to drop in 2011 (see Figure 2).
Figure 2: Median sales price and months supply of inventory, 12-month moving average
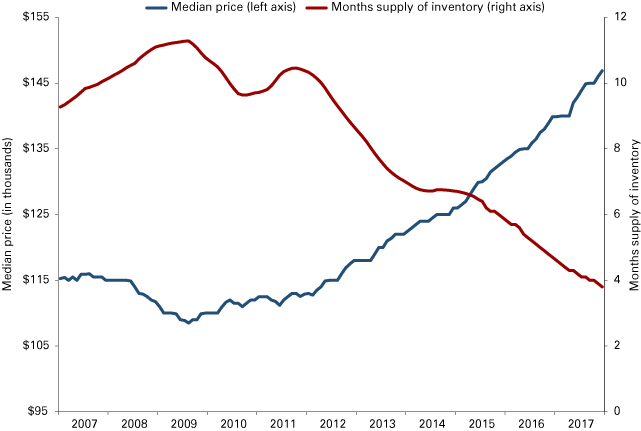
Source: Indiana Association of Realtors
Other measures also indicate that Indiana’s house prices are climbing. According to the Federal Housing Finance Agency’s House Price Index (HPI), Indiana has seen price appreciation for the past 24 consecutive quarters dating back to 2012, and the state’s home prices in the fourth quarter of 2017 are up 6.6 percent from 2016. This rate of appreciation ranked 24th-fastest nationally. Indiana’s growth in house prices lagged neighboring Michigan (9.6 percent) and Ohio (7.4 percent) but outpaced Kentucky (5.6 percent) and Illinois (5.0 percent), as seen in Figure 3.
Figure 3: Change in House Price Index by state, 2016 Q4 to 2017 Q4
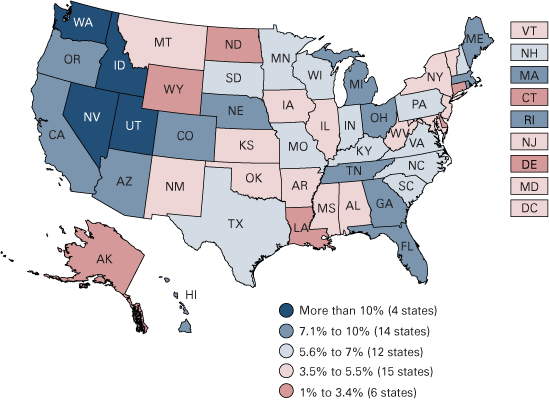
Source: Federal Housing Finance Agency House Price Index (expanded data series, seasonally adjusted)
Indiana’s foreclosure rate continues to fall
According to the Mortgage Bankers Association, the state’s foreclosure rate has dropped more than 3.5 percentage points from its peak of 4.9 percent at the end of 2011 to 1.4 percent in the fourth quarter of 2017 (see Figure 4). This is Indiana’s lowest foreclosure rate since 2000. Even with this drop, Indiana’s foreclosure rate remains slightly above the U.S. average and ranks 20th-highest among states.
Figure 4: Share of mortgages in foreclosure
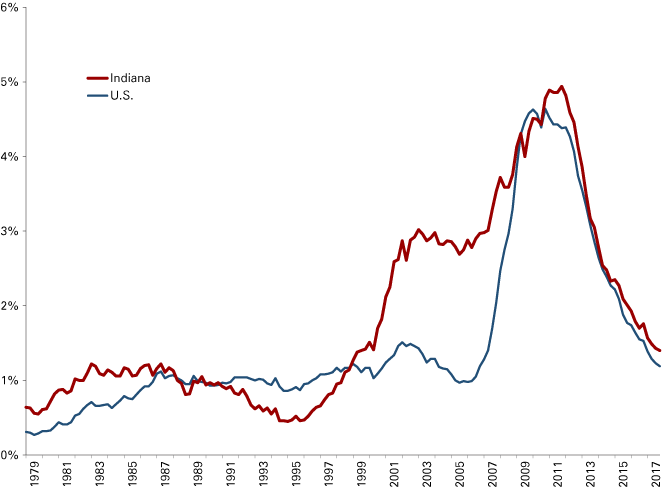
Source: National Delinquency Survey, Mortgage Bankers Association
Demographic drivers of housing market begin to perk up
After being a drag on Indiana’s housing market for several years, the demographic drivers of the housing market are beginning to show some improvement. For instance, population growth of 32,800 residents in 2017 was the state’s largest annual gain since 2009. This strong showing last year offers some hope that population growth will rebound fully over the next few years—but it doesn’t change the fact that the state has been mired in its slowest stretch of population growth since the mid-1980s. Over the past seven years, Indiana has grown by an average of roughly 25,300 people a year, which is less than half the average annual gain during the 1990s (53,600 per year) and still well below the average mark set during the 2000s (40,300).
An additional bright spot in the population numbers is that some important age groups (from the perspective of the housing market) are showing growth. Indiana’s population between the ages of 25 and 44, for instance, grew by roughly 4,000 in 2016 (the most recent year available). This marks the fourth consecutive year that this young-adult group has grown after declining for at least 12 years previously. This age group, which is typically responsible for net gains in new households and home purchases, will continue to grow as the comparatively large millennial generation comes of age.
The state’s uptick in population growth in 2017 was driven by a relatively strong year for migration to the state. After averaging a net in-migration of just 940 residents per year between 2010 and 2016, Indiana garnered a net inflow of 10,400 residents in 2017.
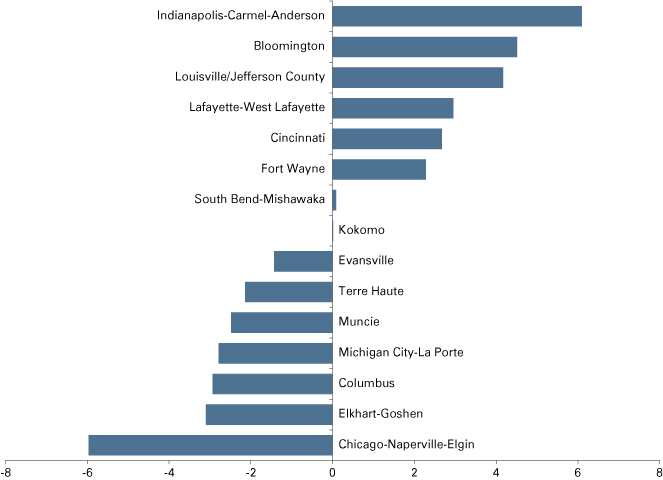
Among metropolitan areas at least partially located in Indiana, the Indianapolis-Carmel-Anderson area had the highest migration rate in 2017, with roughly six net in-migrants for every 1,000 residents (see Figure 5). Other areas with strong migration rates include Bloomington, Louisville, Lafayette, Cincinnati and Fort Wayne. On the other hand, the Columbus, Elkhart and Chicago areas had the largest relative net outflows. The state’s 48 counties not part of a metro area had a combined net out-migration rate of nearly four migrants per 1,000 residents.
Figure 5: Net migration rates for select metro areas, 2017
Source: U.S. Census Bureau population estimates
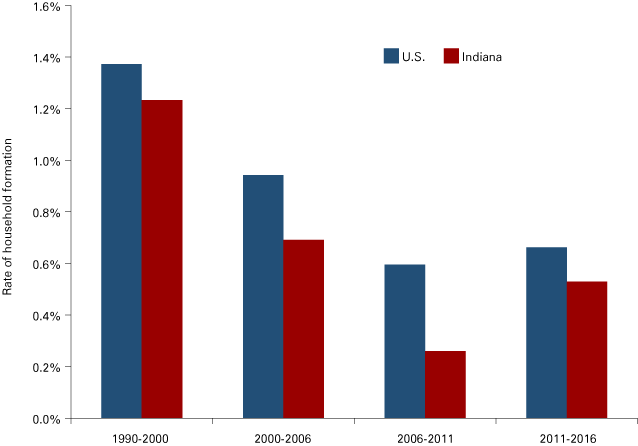
Along with the upbeat news on population gains, Indiana added an estimated 18,100 new households in 2016—the fifth consecutive year of household gains and the second-largest annual increase in that stretch. In all, Indiana has had an average annual household formation rate of 0.5 percent over the past five years. This recent rate of household growth lags the pace set between 2000 and 2006, but is an improvement over the “housing bust” era (see Figure 6).
Figure 6: Average annual household formation rates
Source: U.S. Census Bureau, decennial census and American Community Survey
Indiana’s homeownership rate holds steady in 2016
After dropping more than 3 percentage points from 72.1 percent in 2006 to 68.5 percent in 2013, Indiana’s homeownership rate appears to have stabilized recently. The state’s homeownership rate came in at an estimated 68.3 percent in 2016, and there has not been any statistically significant shifts in this measure over the past three years.
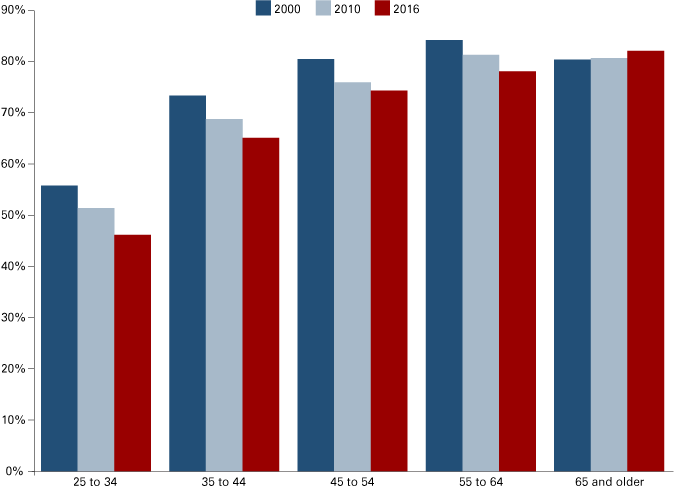
While a stable homeownership rate is certainly a positive development for the state, this overall rate obscures the fact that Indiana has seen more significant declines for most age groups. Since 2000, for instance, the homeownership rates for Hoosiers in the 25-to-34 and 35-to-44 age groups have declined by 10 percentage points and 8 percentage points, respectively (see Figure 7). Over the same period, the homeownership rate for those between the ages of 45 and 64 has dropped 6 percentage points. Only Indiana’s senior age group has seen an uptick in its homeownership rate over the last 16 years.
Figure 7: Indiana homeownership rates by age
Source: U.S. Census Bureau, decennial census and American Community Survey
The difference between the comparatively small change in the state’s overall homeownership rate compared to these sizable declines in many age groups is explained by the fact that the Indiana population is growing older and the likelihood of being a homeowner increases with age. With the baby-boom generation now between the ages of 54 and 72, this age group holds a larger share of the state’s population than ever before. This is also the prime age group for homeownership. As a result, the continued aging of this outsized cohort will boost the state’s total homeownership rate, even if age-specific rates only hold constant going forward.
Residential construction beginning to improve
There were building permits issued for 21,664 new residential units in Indiana in 2017. This represents a 16 percent increase over 2016 and is the state’s highest total since 2007. New single-family homes account for the lion’s share of the state’s building permits in 2017 with 16,075 new units—a 14 percent increase year-over-year.
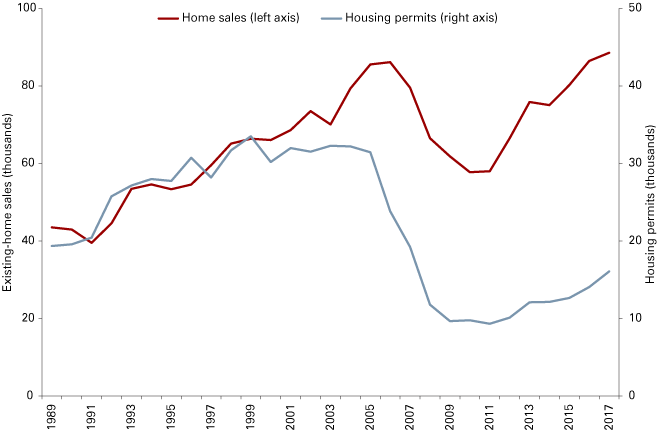
While growth in building permits is a positive development, residential construction continues to play a smaller-than-usual role in the state’s overall housing market. This fact is illustrated by the wide gap between the number of existing-home sales in the state and the number of new single-family permits. From 1988 to 2005, there was a fairly consistent ratio of approximately two existing-home sales for each single-family building permit in Indiana (see Figure 8). In 2017, however, that ratio was roughly six-to-one. Given the current situation of strong buyer demand but low inventory of existing homes for sale, new home construction will almost certainly continue to improve over the next few years.
Figure 8: Indiana existing-home sales and single-family housing permits
Source: U.S. Census Bureau, Moody’s Economy.com, Indiana Association of Realtors
Conclusion
Most indicators show that Indiana’s housing market is in good shape. The state had a record number of existing-home sales in 2017 and house price appreciation is as strong as we have seen in the last quarter century. Additionally, Indiana’s foreclosure rate continues to fall and residential construction is finally beginning to perk up. With Indiana’s economy doing fairly well and mortgage rates likely to stay below 5 percent for a while longer, these facets of the housing market will likely remain strong.
Residential construction, in particular, should be the indicator to watch in 2018. Another leap forward in new home construction is sorely needed to help alleviate problems caused by the short supply of existing homes on the market. Inventory constraints could become even more of a concern if stronger net in-migration and the emergence of the millennial generation trigger stronger household formation rates over the next few years.
Of course, the strength of the Indiana economy will determine whether measures such as residential construction and household formation rates improve. Growth in employment and wages will draw more people to the housing market and spur new construction. If the state’s economy can continue to improve, the Indiana housing market could soon be hitting on all cylinders.
For additional detail about the Indiana housing market in 2018, see the full report, "The State of Indiana's Housing Market," available at https://ibrc.kelley.iu.edu/analysis/reports/index.html.
