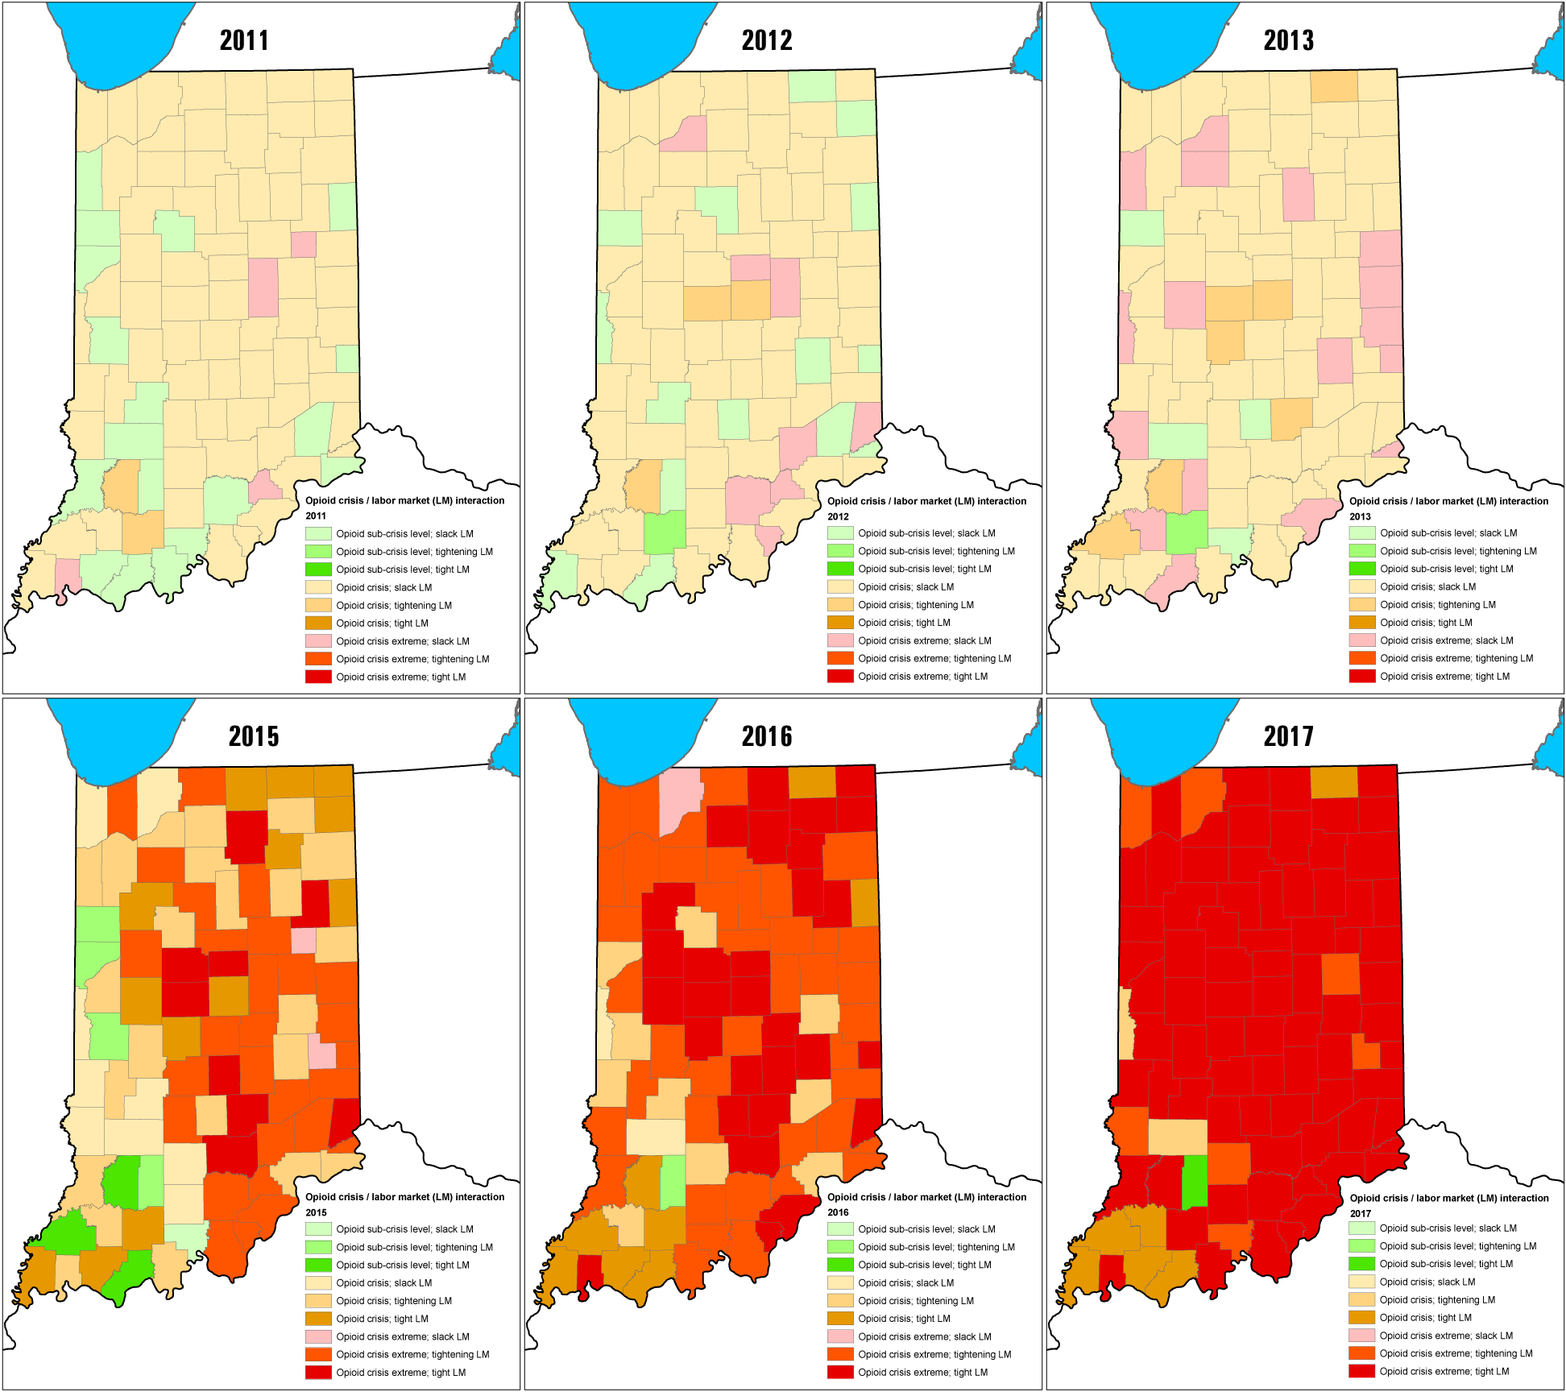
Visualizing opioid misuse and labor market tightness over time
Associate Professor of Finance, Indiana University Division of Business, Indiana University–Purdue University Columbus
Professor of Geography, Indiana University Division of Liberal Arts, Indiana University–Purdue University Columbus
Doctoral Candidate in Finance, Kelley School of Business, Indiana University Bloomington
Like other states in America, Indiana currently finds itself in the midst of a severe public health crisis—the opioid misuse epidemic. This epidemic is, of course, the cause of immeasurable heartache, loss and suffering on a scope difficult for any words to effectively capture. To assist leaders and stakeholders in Indiana with identification and ultimately implementation of solutions capable of eliminating the epidemic, we feel it is important as an initial step in the process to quantify economic damages. Doing so can provide measurement context—so we can better understand the magnitude of the effects of the crisis on our economy and our growth potential. Furthermore, quantifying economic damages will allow government, business and other thought leaders to better assess how important the epidemic is from an investment-in-solutions perspective.
This article presents a visualization of the crisis in a way that captures a core component of total economic damages: losses to gross state product (GSP). In this context, counties experiencing tighter labor markets can less afford to lose laborers to the opioid crisis, as positions are already difficult to fill. Mapping this problem across the state’s 92 counties over time gives readers quick, intuitive insight as to where the problem is hitting our state hardest, which allows leaders of those communities to redouble their focus as we attempt to develop solutions to the evolving, costly epidemic.
In a separate article in this issue, the authors estimated that the cumulative cost of the opioid epidemic to the state of Indiana through December 31, 2017, totaled $43.3 billion.1 Moreover, the ongoing annual costs have been accelerating, with 2017 damages totaling approximately $4.3 billion. We expect economic damages from opioids misuse in 2018 in Indiana to again exceed $4 billion.
These initial state-level numbers are helpful in highlighting the costs to us as a statewide community. However, opioid misuse costs are not materializing equally across the local areas wherein each of us commonly work, socialize, raise children and recreate. Differences in costs at the local level surface from differences in misuse rates, emergency response consumption rates and overdose death rates—which all vary by local community. Further, it has been established that the current crisis harms geographic locations experiencing high levels of labor market tightness.2
Labor markets
As we discuss the intersection of labor market slack and opioid misuse, it should be noted that we neither argue that opioid misuse causes labor market slack, nor that labor market slack causes opioid misuse. Rather, we are presenting these conditions together, as they are, without reference to causality. We look at the intersection of labor market slack and opioid misuse, because in times of tight labor markets (or full employment)—when economic productivity is constrained by a shortage of labor supply—any reduction of workforce size translates to economic losses for the state. Opioid misuse reduces workforce size, which results in lost productivity and wages, and leads to lost GSP.
Because labor markets are not generally statewide by their nature, it is valuable to explore the opioid crisis through the lens of cartographical analysis. Labor markets are formed vis-à-vis commuting patterns, matching labor supply and demand in geographic regions. In an ideal world, we would have precise information about each of Indiana’s labor markets in a way that accounts for overlapping, porous boundaries. Of course, this is not possible. For instance, Johnson County lies in at least three labor markets—Indianapolis, Columbus and Greenwood, for starters. Yet, because the data are collected on a county-level basis, we can measure this as a point of reference. Of course, where appropriate, counties comprising larger labor markets could easily be combined. However, because opioid misuse and overdose rates vary considerably, the geographic region “by county” is better equipped to provide guidance to local leaders who need to address the crisis at the local level.
While the authors found that the crisis began in Indiana in 2003, the maps in this article depict the cross-section of opioid severity and labor market tightness for Indiana counties over the most recent seven years (2011 to 2017).
Map reading guide
- Darker colors imply tight labor markets, while lighter colors imply slack in labor markets. In general, a pale color implies a slack (loose or unhealthy) labor market. The ideal labor market is reflective of “full employment,” wherein equilibrium exists between employers seeking workers and labor force participants seeking jobs.
- Green represents sub-crisis opioid levels. In the context of this article, “sub-crisis” refers to the level of opioid misuse in the year 2002 and before. In our accompanying article, Cumulative economic damages from 15 years of opioid misuse throughout Indiana, we describe how the opioid epidemic began in 2003, when statewide rates of opioid misuse escalated sharply from 2002 levels and never returned. Thus, sub-crisis refers to a specific county having an opioid misuse measurement (measured by deaths and emergency room visits) at or below statewide misuse levels prevalent in 2002 or before.
- Tan and brown represent opioid crisis levels. “Opioid crisis” level implies county-level misuse indicators (deaths and ER visits) having reached or exceeded 2003 levels. Pale brown (tan) implies crisis-level opioid misuse rates coincident with slack in that labor market.
- Pink and red represent an “extreme opioid crisis,” which is defined as 10 times the 2002 opioid misuse measurement based on deaths and ER visits. Pale red (pink) indicates slack in the local labor market, medium red indicates a tight labor market at about “full employment” level, and the darkest red indicates that the local labor market is very tight with unemployment rates lower than “full employment” and labor force participation rates higher than the national average.
- Dark green is the ideal color, representing a tight labor market (and thus a productive economy) and opioid consumption at the “sub-crisis” level, which we have modeled as at or below 2002 opioid misuse numbers. When the labor market has been looser but there still existed a sub-crisis level of opioid consumption, the color changes to lighter shades of green.
Change over time
2011
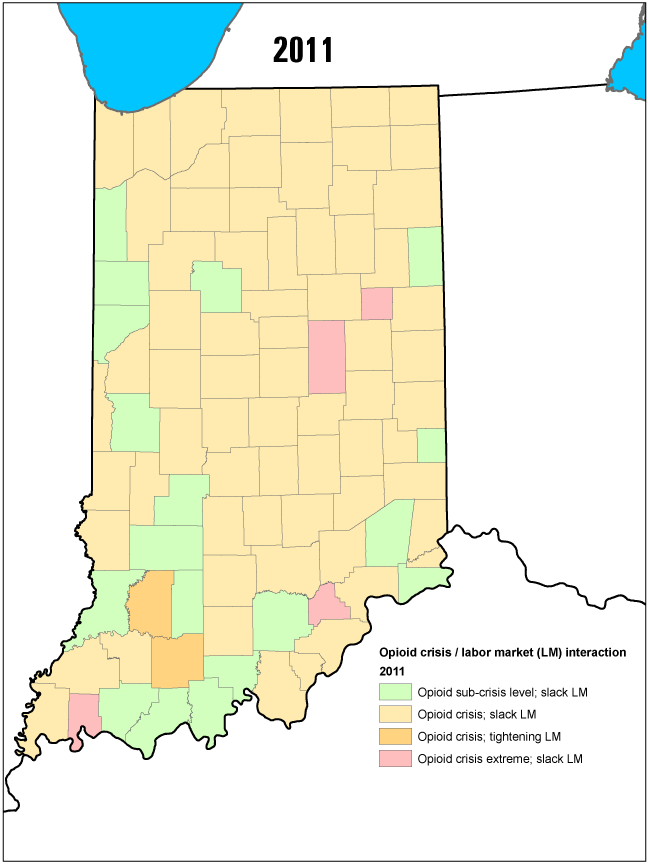
Indiana was generally well into the opioid crisis with emergencies (i.e., overdose deaths and emergency room visits from opioid overdose) above 2002 levels in 74 of 92 counties. Four counties can be seen with opioid severity levels at or greater than 10 times 2002 levels, implying an “extreme opioid crisis” within these labor markets. Only two counties in the state showed signs of labor market tightening in 2011 (see Figure 1).
Figure 1: Opioid misuse and labor market tightness, 2011
Source: Authors’ calculations
2012
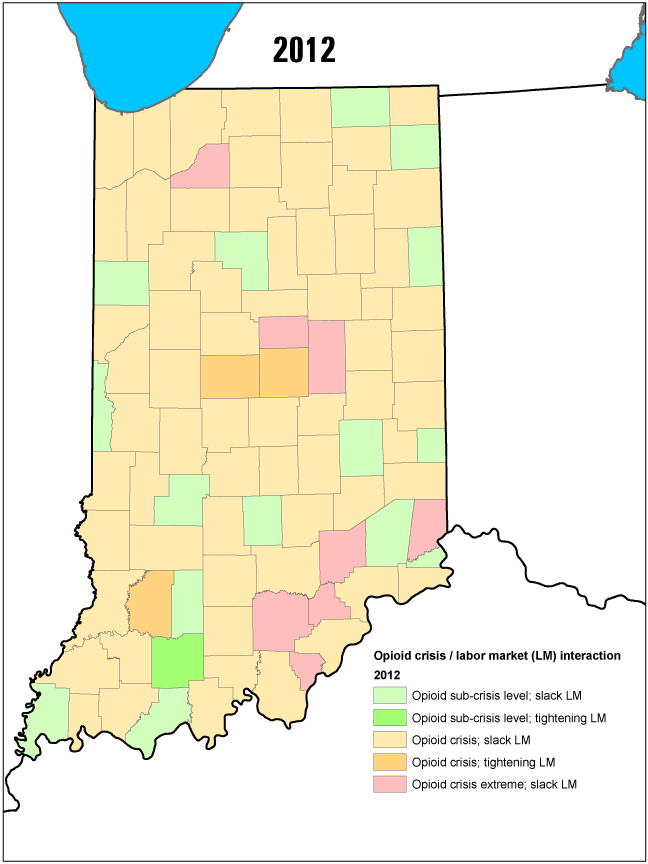
Only 16 counties in Indiana remained at opioid sub-crisis levels. Of the four counties with tightening labor markets, three were also experiencing the opioid crisis. The geographic nature of the opioid crisis can be seen taking shape in 2012, with five of the eight counties suffering from “extreme opioid crisis” just north of the Ohio River, ranging from Louisville to Cincinnati (see Figure 2).
Figure 2: Opioid misuse and labor market tightness, 2012
Source: Authors’ calculations
2013
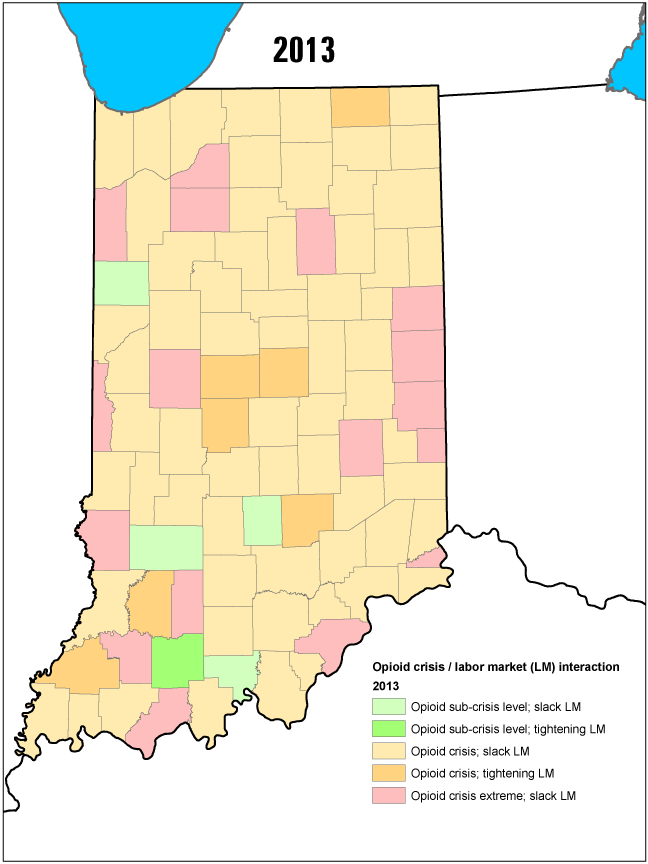
The number of counties in Indiana with tightening labor markets doubled from four to eight, over the year prior. Meanwhile, the number of counties with “extreme crisis” in the opioid epidemic more than doubled, from eight counties in 2012 to 17 counties in 2013. Parts of southern Indiana appeared to show some resistance to the epidemic (or had been experiencing underreporting of opioid misuse outcomes), with four southern counties at sub-2002 opioid severity levels (see Figure 3).
Figure 3: Opioid misuse and labor market tightness, 2013
Source: Authors’ calculations
2014
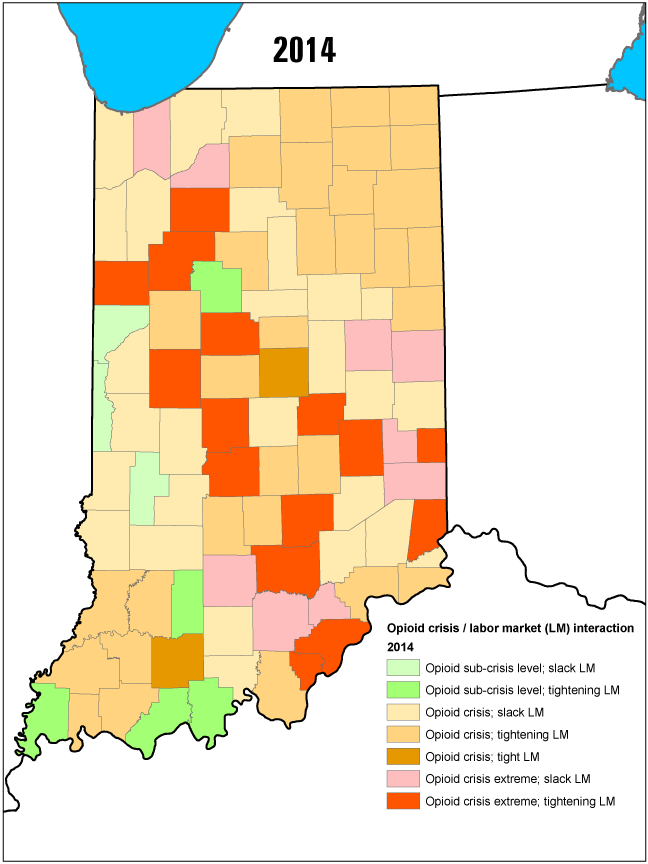
The big news this year was the economic improvement in dozens of labor markets around the state, with county unemployment rates dropping to tight levels in many of the counties along interstates 65 and 69. Meanwhile, the number of counties suffering from “extreme opioid” severity jumped from 17 to 24, an increase of 41 percent. The opioid crisis worsened in southeastern Indiana, apparently emanating from Louisville and Cincinnati; we can see misuse patterns prevalent along interstates 65 and 74 in those areas.
Numerous counties were experiencing both low unemployment levels and significant opioid crisis levels (see Figure 4).
Figure 4: Opioid misuse and labor market tightness, 2014
Source: Authors’ calculations
2015
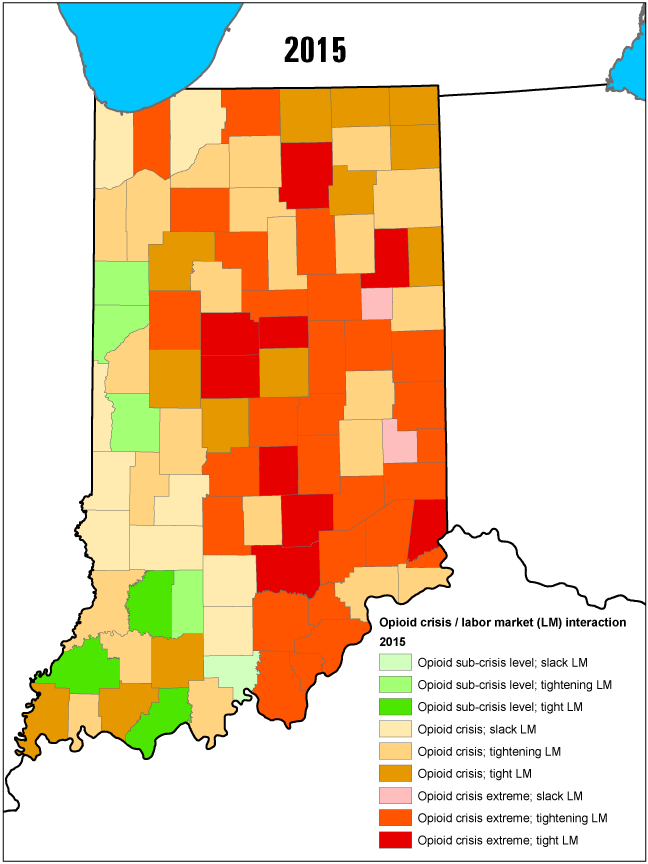
This year became known for the infamous Scott County HIV outbreak, wherein the Centers for Disease Control and Prevention estimated that nearly 200 people in Scott County contracted the disease via intravenous drug injection. Reports suggest the drug was known as “Opana,” a prescription opioid used for pain management. This was the year the general public began to become aware of the magnitude of the opioid epidemic in the state of Indiana (see Figure 5).
Figure 5: Opioid misuse and labor market tightness, 2015
Source: Authors’ calculations
2016
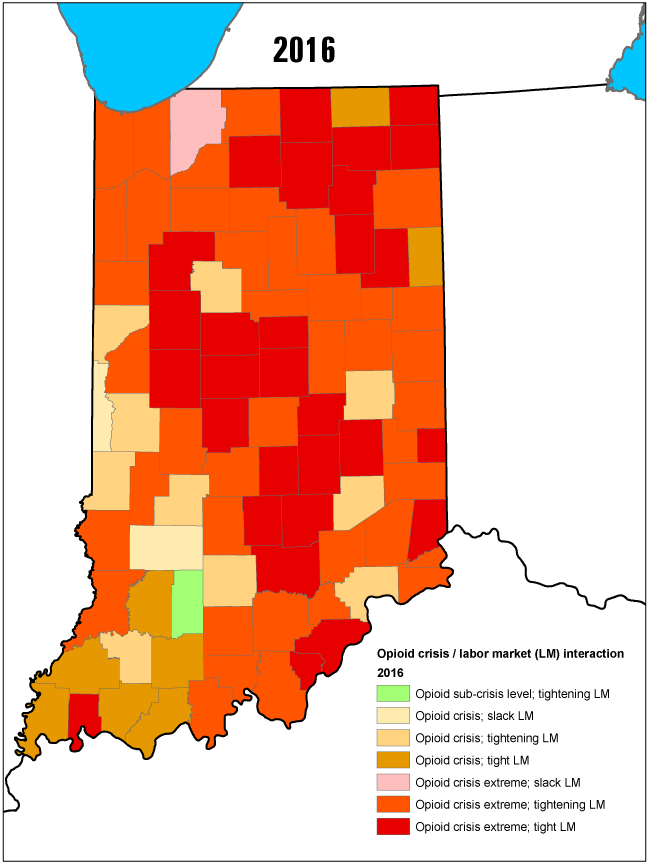
The severity of the opioid crisis in Indiana had become widespread and dramatic, with nearly all counties ranging from Chicago through Indianapolis and down to Louisville and Cincinnati significantly affected (see Figure 6). Also, most labor markets across eastern and southern Indiana were at or below “full employment” levels; in fact, by 2016, only three Indiana counties were measured as having “slack” labor markets. These conditions are costly from a gross state product (GSP) perspective.
Figure 6: Opioid misuse and labor market tightness, 2016
Source: Authors’ calculations
2017
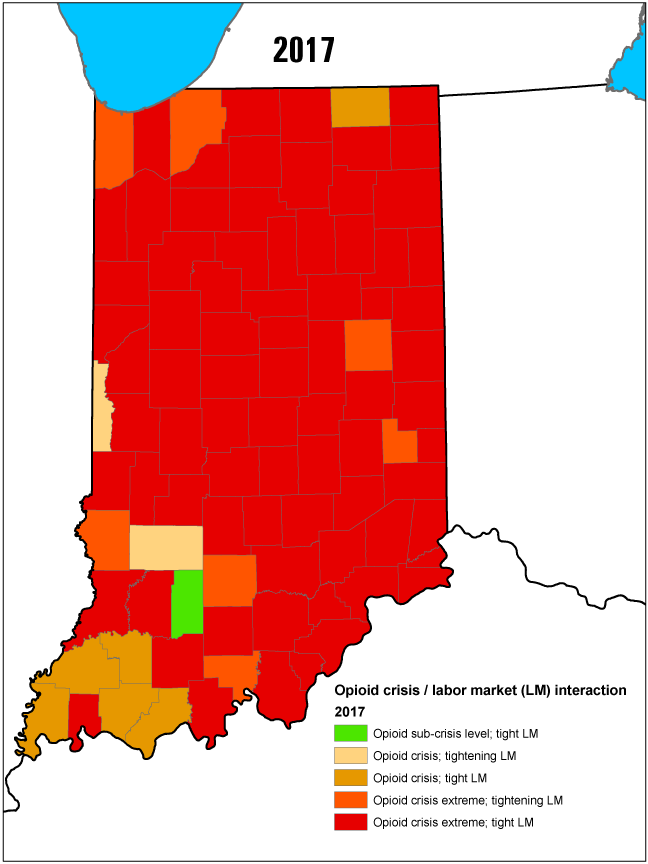
Indiana experienced ubiquitously tight labor markets throughout the state, without exception, while simultaneously, the opioid crisis continued to accelerate into extremely severe conditions, with death and emergency outcomes at or above 10 times 2002 levels throughout the majority of Indiana (see Figure 7). Forecasts for 2018, 2019 and even 2020 reflect more of this kind of interaction, barring effective solutions at local levels.
Figure 7: Opioid misuse and labor market tightness, 2017
Source: Authors’ calculations
Conclusion
Given the visualization of the problem through the lens of cartography at the county level, we can see that the opioid crisis has harmed some counties more than others. Also, we can see the geographic nature of the epidemic materialize over time, providing local leaders information about the proximity of the crisis to their communities. Further, we see that ongoing damages as of this writing have been accelerating due to rising misuse rates and associated direct costs, as well as because statewide labor shortages yield greater losses to GSP. Because each county has a unique labor market and unique opioid misuse characteristics, the questions are now raised—What are the estimated cumulative costs to each county? What are the ongoing costs?
Answers to these questions are provided in a third article on this topic. In this accompanying article, a tool is provided, allowing leaders of communities throughout Indiana the opportunity to input real-time misuse data and have an estimate of ongoing damages in their counties. This insight can provide our local leaders a better understanding of the magnitude of economic damages suffered by their constituents. Specifically, city, county and township budgets are impacted by local decisions made in response to the epidemic. Enumerating the extent of damages at the local level will help inform the decision of how to allocate resources toward the development of community-level solutions. Also, within communities experiencing particularly steep opioid-related damages, local businesses will be better able to assess their willingness to contribute to solutions.
The opioid epidemic is a national problem, certainly. It is also a state problem. A comprehensive solution set to this problem will likely include a portfolio of components at national, state and local levels. By shedding light on the state of Indiana as a system of interconnected, individual counties, we hope to help provide improved understanding of the crisis and foster development of effective solutions throughout the communities of Indiana and beyond.
Notes
- Brewer, R. M., & Freeman, K. M. (2018). Cumulative economic damages from 15 years of opioid misuse throughout Indiana. Indiana Business Review, 93(1). Retrieved from www.ibrc.indiana.edu/ibr/2018/spring/article1.html
- Brewer, R. (2017). The economic impact of opioid misuse in Indiana. Indiana Business Review, 92(4). Retrieved from www.ibrc.indiana.edu/ibr/2017/outlook/opioid.html


