Housing: Positive outlook for 2019

Senior Demographic Analyst, Indiana Business Research Center, Indiana University Kelley School of Business
The Indiana housing market in 2018 has been a study in extremes. For instance, house prices increased by nearly 8 percent over the last year—the state’s strongest rate of appreciation on record (see Table 1). Surging prices have yet to temper demand, however, as Indiana is on track to set a new high watermark for annual existing home sales. Meanwhile, the inventory of homes on the market continues to dwindle—yet new residential construction, while clearly on the rise, remains slow by historic standards, especially for smaller, entry-level homes.
So while the market is poised for another strong year in 2019, some of these trends are surely unsustainable, which suggests there could be some market shifts on the horizon.
Table 1: Housing market overview
| U.S. | Indiana | |
|---|---|---|
| Existing home sales, September year-to-date, year-over-year change | -1.8% | 1.2% |
| House price appreciation, 2017 Q2 to 2018 Q2 | 7.0% | 7.7% |
| Residential building permits, September year-to-date, year-over-year change | 5.2% | 6.7% |
| Foreclosure rate, 2018 Q1 | 1.2% | 1.4% |
| Months supply of existing home inventory, 2018 Q3 | 4.3 | 3.6 |
Source: Indiana Association of Realtors, National Association of Realtors, Federal Housing Finance Administration, U.S. Census Bureau and the Mortgage Bankers Association
2018 in review
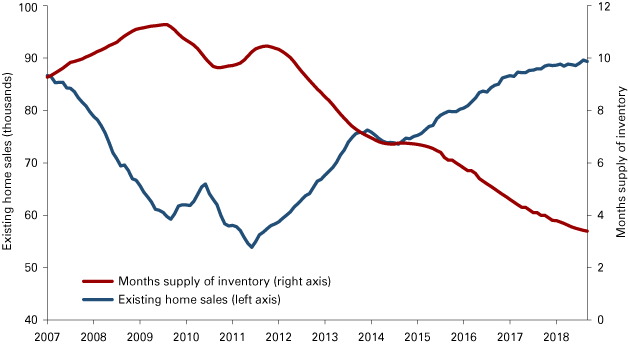
Indiana is on pace for more than 89,000 existing home sales in 2018. If the state reaches this mark, it would be the second consecutive year Indiana posts a record sales tally. Such strong demand, coupled with relatively low levels of residential construction, has contributed to a dramatic decline in the inventory of homes on the market (see Figure 1). In fact, Indiana’s average monthly inventory is likely to drop by at least 12 percent in 2018, which would be the third consecutive year with a double-digit decline in this measure.
Figure 1: Indiana existing home sales and months supply of inventory, 12-month moving average

Source: Indiana Association of Realtors
With such an imbalance between supply and demand, it’s no surprise that prices are climbing. Through the first three quarters of 2018, Indiana’s median sales price for existing homes stood at $159,000—up nearly $13,000 over the same period in 2017. The Federal Housing Finance Agency’s House Price Index—a more reliable measure of price changes—indicates that Indiana’s house prices increased 7.7 percent over the past year.
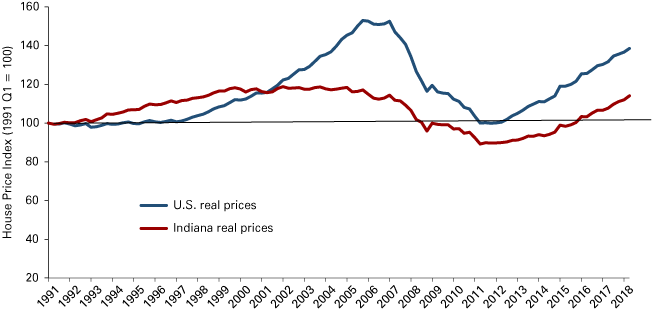
Figure 2 shows the trend in Indiana’s house prices in real terms (i.e., adjusted for inflation). When measured in real terms, prices in the state have shown sustained growth in recent years for the first time since the 1990s, and are now just 4 percent off the peak prices set in 2002.
Figure 2: House Price Index adjusted for inflation, 1991 Q1 to 2018 Q2

Note: The HPI values are adjusted for inflation using the Consumer Price Index for all items less shelter (Series SA0L2)
Source: Federal Housing Finance Agency, House Price Index (expanded data series, seasonally adjusted)
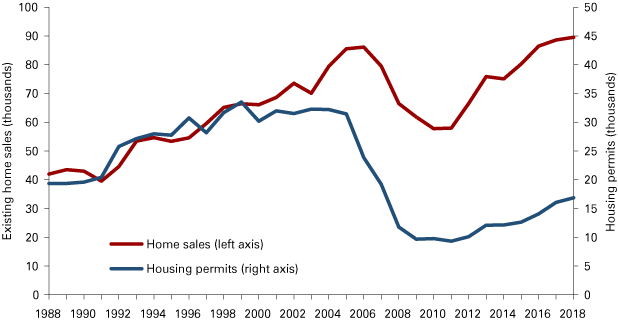
Short supply and rising prices would seem to indicate the need for more new construction. Indiana has seen an uptick in building, with the number of new units up nearly 7 percent year-over-year through the first three quarters of 2018. That said, residential construction remains relatively low. This point is best demonstrated by comparing new construction to existing home sales. Between 1988 and 2005, there was a fairly consistent ratio of approximately two existing home sales for each single-family building permit in Indiana (see Figure 3). In 2018, however, that ratio will likely be five-to-one. This gap has begun to narrow over the last two years, but we will likely have to see the construction of more low-to-moderate priced homes before there is a significant shift in this trend.
Figure 3: Indiana existing home sales and single-family housing permits

Note: The IBRC estimated the values for 2018 based on data for the first three quarters of the year.
Source: U.S. Census Bureau, Moody’s Economy.com, Indiana Association of Realtors and the Indiana Business Research Center
Outlook
At the national level, the consensus outlook points to a continued uptick in construction and—after a decline in 2018—a slight improvement in total home sales (see Table 2). Meanwhile, prices will continue to rise, although at a slower pace than in the last year, and mortgage rates will likely climb above the 5 percent mark for the first time since 2011.
Table 2: National housing outlook, 2019
| 2018 | 2019 | Percent change | |
|---|---|---|---|
| Housing starts (thousands) | 1,280 | 1,340 | 4.7% |
| Total home sales (thousands) | 6,070 | 6,242 | 2.8% |
| Median price, existing homes (thousands) | $261.4 | $272.9 | 4.4% |
| 30-year fixed mortgage rate | 4.7 | 5.1 |
Note: The values in this table are an average of the projections from each organization’s October 2018 economic forecasts.
Source: National Association of Realtors, Mortgage Bankers Association and Freddie Mac
Here in Indiana, with the inventory of homes on the market likely to remain exceptionally low in 2019, we expect that residential construction will expand for the fifth consecutive year—though the existing home market may have a tough time improving on what should be a record sales tally this year. Given these supply constraints, house price gains in Indiana will continue to outpace inflation in 2019, but will almost certainly fall short of the brisk 7.7 percent increase over the past year.
One concern is that the combination of a lack of supply, rising prices and higher mortgage rates will mean that more and more would-be homeowners will find it difficult to purchase a home. But with a positive outlook for Indiana’s economy in 2019, the state’s housing market will likely remain strong in the next year. However, Indiana certainly needs to see an increase in construction—particularly for lower-to-moderately priced homes—to help bring more balance to the housing market.


