Workers' share of GDP
Economist
Everyone likely to read these words knows that GDP stands for "gross domestic product," the value of goods and services produced and sold in the marketplace in the United States in a given period of time. It’s reported quarterly by the U.S. Bureau of Economic Analysis, with monthly updates. Politicians have plans to make it grow faster (as if it were a favorite garden flower).
Most students of economics learn that GDP has three familiar components: consumer spending (C), business investment (I), and government spending (G). Those who are paying good attention learn that exports minus imports (E-X) are also part of GDP. But there is another side to GDP, the distribution of those dollars in the economy.
In this article, we examine the three components of that other side: employee compensation, taxes less subsidies and gross operating surplus. We define these components, look at their changes over time and explore how they differ by state—with specific reference to Indiana.
Definitions
Simply put:
- Employee compensation is what workers and executives get paid.
- Taxes less subsidies are the net of what business pays to government for services rendered to the firm or society in general (social overhead, if you will), less whatever subsidies the firm gets as an incentive for, presumably, advancing economic welfare.
- Gross operating surplus represents what is left after employees, suppliers and net taxes are paid. This pre-income tax sum includes depreciation and is available to those who own the firm or hold its debt.
More formal definitions are provided in the accompanying box.
Changes over time
Full details of GDP for 2015 were released after the computations and text for this article were well-advanced, but we still have a good historical record from 1997 to 2014, and little expectation that the latest data would change the picture.1
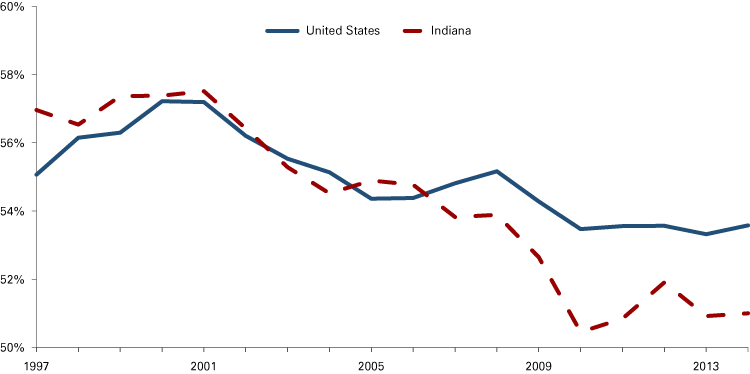
Figure 1 depicts compensation of employees as a share of GDP for Indiana and the United States in 1997 and in 2014. In both cases, the share of GDP going to employee compensation declined. For the U.S., it was a drop from 55.1 percent to 53.6 percent, or 1.5 percentage points. However, Indiana saw a greater decline from 57.0 percent to 51.0 percent, or 6 full percentage points— four times the decline experienced by the nation. Employees in no other state lost as much ground as did those in Indiana.
Figure 1: Compensation of employees as a percent of GDP

Source: U.S. Bureau of Economic Analysis
Moreover, Hoosier employees went from enjoying a greater share of state GDP to a lower share than U.S. workers in general. In 1997, Hoosiers had a 1.9 percentage point lead on U.S. workers, an advantage that fell to a 2.6 point deficit by 2014.
Behind these results are the differential growth rates of GDP and compensation for the U.S. and Indiana. These are shown in Figure 2, where, for example, in 2010 Indiana’s GDP grew 3.7 percentage points faster than the nation’s; meanwhile, the state’s compensation growth was only 0.8 percentage points better than the U.S.
Figure 2: Growth rate differentials: Indiana minus the United States

Source: U.S. Bureau of Economic Analysis
Only twice during the 1998 to 2014 period did Indiana’s growth of GDP exceed that of the U.S. by 1 percent or more. Yet seven times in those 17 years, Indiana’s GDP growth was at least 1 percent behind the nation’s. In addition, 13 of those 17 years showed Indiana’s growth in compensation lagged the U.S.
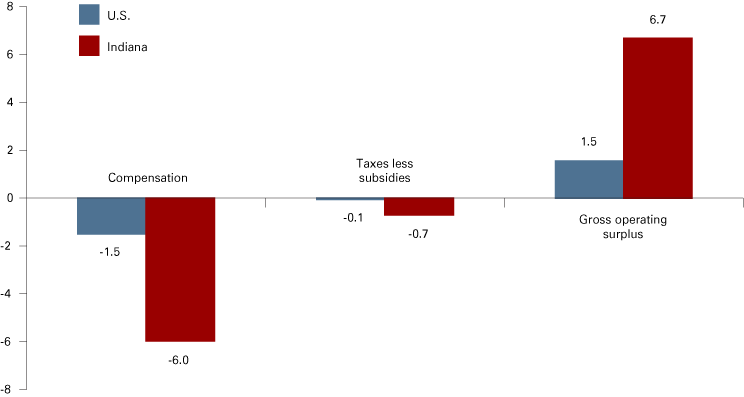
A similar pattern is found with taxes less subsidies. In both the U.S. and Indiana, taxes less subsidies declined as a percent of GDP over the same period (see Figure 3). The decline in share in the Hoosier state exceeds that in the nation.
Figure 3: Changes in share of GDP, 1998 to 2014

Source: U.S. Bureau of Economic Analysis
Without excessive calculation, it is evident that gross operating surpluses gained shares of GDP. This fact also appears in Figure 3 where Indiana businesses gained 5 percentage points on their U.S counterparts. Only North Dakota saw a greater growth in this factor (8.1 percentage points) than did Indiana (6.7 points).
In summary, from 1998 to 2014, employees and governments were losing ground to the claimants on the gross operating surpluses of the nation’s companies—mainly shareholders and the holders of debt.
These are substantial shifts when one recalls the trillions of dollars represented by GDP. A slight shift of one-tenth of 1 percent in GDP in 2014 was $17 billion.
State differences
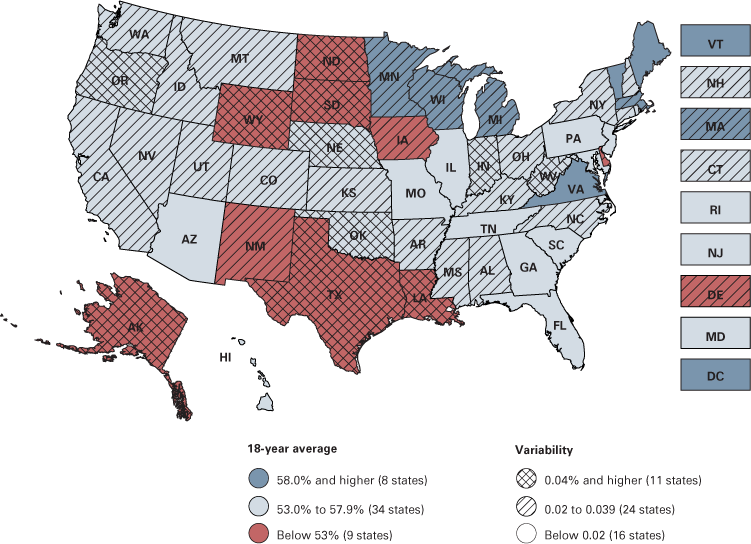
A state-by-state depiction of the average compensation of employees per dollar of GDP over the study period is shown in Figure 4. The United States averaged 52.0 percent; in Indiana, it was 54.3 percent—33rd in the nation. At the same time, the entire country showed a coefficient of variation (a measure of volatility)2 of 0.024, while Indiana was nearly twice as high at 0.045 (the ninth highest among the states, including the District of Columbia).
Figure 4: Compensation of employees per dollar of GDP, 1997 to 2014 average

Source: U.S. Bureau of Economic Analysis
We can suggest that a high level of compensation per dollar of GDP is a favorable condition. But that may be very wrong, and it does not mean high wages are to be found in such a state. If the value of GDP per employee is low, it could indicate a weak economy, one not employing technology to boost worker productivity, or producing goods not much in demand. To have a large share of a small pie may not please every palate.
The volatility (or variability to be less dramatic) of compensation per dollar of GDP is another metric worth considering. Variability is not necessarily unfavorable, if the average level of compensation is high. Alaska and Wyoming, however, demonstrate low shares of compensation with high levels of variability. Both states are heavily engaged in capital-intensive, extractive industries subject to volatile market pricing.
Vermont, in contrast, is a state where compensation has a high share of GDP and low variability. Again, without further research, it would be premature to pass judgment on the desirability of this condition.
Final note
Each of these changes is a complex mix of industry considerations. The adaptation of technology and improved managerial practices influence the distribution of GDP to these three factors of production. Location decisions may be of importance. Some firms consolidate closer to their headquarters. In other cases, headquarters themselves move from one state to another. Where firms choose to locate may be a matter of changes in selected state and local taxes, but location decisions are more likely made as channels of distribution change and the prices of inputs rise or fall. These latter matters extend far beyond the purview of this article and state legislatures.
Notes
- Gross Domestic Product (GDP) estimates for the nation and the states are generated quarterly by the U.S. Bureau of Economic Analysis (BEA); Metropolitan area estimates are available annually.
- The coefficient of variation equals the standard deviation of a series divided by the mean of that series. Higher numbers indicate greater variability.


