
The economic impact of opioid misuse in Indiana

Associate Professor of Finance, Indiana University Division of Business, Indiana University–Purdue University Columbus
In Indiana, we have begun to see situations where continued gross state product (GSP) growth is challenged by a limit of available labor. While economic forecasts suggest 2 to 3 percent GSP growth is likely in 2018, the achievement of that kind of growth will rely in part on new jobs.
However, with more working-age residents choosing to remain part of the labor force, coincident with a continuously decreasing unemployment rate, Hoosier employers have been finding it challenging to fill vacant positions. The Hoosier labor force has not been keeping pace with job growth demands—particularly in areas requiring skilled labor and/or higher educational attainment. With labor markets tightening across the Hoosier state, the widely publicized opioid/opiate epidemic is now not only a terrible social crisis, but it also has become measurable in terms of lost economic output. (Note: For the purposes of this article, we use the terms opioid and opiate interchangeably.)
In this study, the opioid epidemic in Indiana is analyzed through the lens of economics, and an estimate for the current GSP loss arising from opiates and their influence on the Hoosier workforce is presented.
Results
The direct GSP loss to the Indiana economy arising from opiates misuse is measured at $1.5 billion per year. Additional impacts are intangible or indirect in nature—stigma/reputation effects, morbidity effects and service inefficiencies—and they would cause the total annual economic losses in Indiana to be higher.
Background
Opioid misuse directly attenuates the economy by reducing the number of labor force participants and potential participants. For instance, many misusers end up incarcerated. Across America, there were 2.1 million prisoners in December 2015.1 To place this in perspective, the U.S. incarcerates more of its citizens than any other country, jailing 0.7 percent of its total population. Canada incarcerates 0.1 percent of its people, for a comparison. Americans are incarcerated at a rate 700 percent higher than Canadians.
In Indiana, we have 43,500 people in jail as of 2015. The southeastern region of Indiana ranging diagonally from Richmond to Jeffersonville incarcerates residents at comparatively higher rates within Indiana.2 This translates into a 0.9 percent incarceration rate among adults age 18 and older, placing us 19th in the country (approximately the same rate as the U.S. on the whole).3 According to the Bureau of Prisons (2017), 48.6 percent of people incarcerated in federal prisons are there for drug-related offenses. This rate implies Indiana would hold approximately 21,000 prisoners because of illegal drug activity. With recidivism reported to be 76 percent nationally (suggesting current methods for developing character while in prison have limited success), an opportunity arises for Hoosier leaders to pause and try to structurally change how we handle drug-related correctional opportunities. Prisoners cannot add to GSP or employment production numbers in any efficient fashion; therefore, potential reward exists for improving this situation.
More Americans died of opioid overdoses in 2016 alone than Americans died in combat during the entire Vietnam War.
Another common outcome for opiate misusers is death. More Americans died of opioid overdoses in 2016 alone than Americans died in combat during the entire Vietnam War.4 In Indiana, opioid overdose deaths increased 52 percent in 2016 over 2015 levels. Experts anticipate opioid overdoses to continue to increase through the end of 2017.5
Labor force and employment details
The economic recovery has been good for employment numbers in Indiana. Over the past five years of available data (2012 to 2016), the labor force participation rate has been increasing, the unemployment rate has been dropping, and our population has concurrently been getting older. Consequently, the number of people available for work in Indiana has been dropping in concert with the recovery. Table 1 presents the labor force and employment numbers in Indiana and in America (for comparison) from 2012 through 2016, while also highlighting the growing number of residents over age 65.
Table 1: Population and labor force
| 2012 | 2013 | 2014 | 2015 | 2016 | |
|---|---|---|---|---|---|
| Indiana | |||||
| Labor force | 3,159,528 | 3,188,622 | 3,226,755 | 3,265,106 | 3,328,368 |
| Employed | 2,897,939 | 2,943,870 | 3,036,490 | 3,110,813 | 3,177,242 |
| Unemployed | 261,589 | 244,752 | 190,265 | 154,293 | 151,126 |
| Out of labor force | 1,967,314 | 1,971,734 | 1,963,986 | 1,948,063 | 1,910,709 |
| Population (16+) | 5,126,842 | 5,160,356 | 5,190,741 | 5,213,169 | 5,239,077 |
| Population (Over 65) | 815,202 | 844,966 | 871,049 | 895,572 | 919,876 |
| United States | |||||
| Labor force | 155,083,000 | 155,747,000 | 155,682,000 | 156,993,000 | 158,889,000 |
| Employed | 142,391,000 | 144,006,000 | 146,222,000 | 148,742,000 | 151,090,000 |
| Unemployed | 12,692,000 | 11,741,000 | 9,460,000 | 8,251,000 | 7,799,000 |
| Out of labor force | 92,409,306 | 93,989,648 | 96,426,834 | 97,461,351 | 97,864,014 |
| Population (16+) | 247,492,306 | 249,736,648 | 252,108,834 | 254,454,351 | 256,753,014 |
| Population (Over 65) | 39,583,556 | 41,284,537 | 42,831,113 | 44,288,216 | 45,753,305 |
Note: Population data are yearly as of July 1. Employment data are yearly as of June (exact date undisclosed).
Source: U.S. Bureau of Labor Statistics, the U.S. Census Bureau and author’s calculations
The Great Recession left the United States with considerable employment slack, with nearly all industries affected.6 Between December 2007 and December 2009, the U.S. had lost over 8 million jobs. By 2012, the entire country and the state of Indiana were both increasing the labor force and reducing the numbers of unemployed. With economic growth, we have seen job growth in America and in Indiana, and yet the effects on each labor market have been quite different. The available labor force under 66 years old has dropped in Indiana by 14 percent from 2012 to 2016, while this same group nationwide has dropped by only 1 percent (see Table 2). In any normal context, this statistic would be heralded unquestionably as good news—showing the work ethic and moxie of Hoosiers, as our pace of reentrance into the workforce has been impressive. However, looking forward, the challenge is to find new job growth and to be able to effectively fill newly created positions.
Indiana’s working-age labor force (theoretically) available for employment was just about 991,000 in 2016, 14 percent less than what it had been four years prior, when it measured about 1.15 million. In the United States as a whole, the working-age labor force (theoretically) available for work dropped only slightly—from about 52.8 million in 2012 to about 52.1 million as of the end of 2016. Therefore, the Indiana labor market has tightened considerably more than has the U.S. labor market, creating a condition wherein the marginal strain on labor in Indiana caused by the opioid crisis is relatively more expensive.
Table 2: The available labor force under 66 years of age in Indiana and the U.S.
| Indiana | 2012 | 2013 | 2014 | 2015 | 2016 | |
|---|---|---|---|---|---|---|
| Available labor force under 66 | 1,152,112 | 1,126,768 | 1,092,937 | 1,052,491 | 990,833 | |
| Percentage decrease | 2.2% | 3.0% | 3.7% | 5.9% | ||
| Labor force participation | 61.6% | 61.8% | 62.2% | 62.6% | 63.5% | |
| United States | 2012 | 2013 | 2014 | 2015 | 2016 | |
| Available labor force under 66 | 52,825,750 | 52,705,111 | 53,595,721 | 53,173,135 | 52,110,709 | |
| Percentage decrease | 0.2% | -1.7% | 0.8% | 2.0% | ||
| Labor force participation | 62.7% | 62.4% | 61.8% | 61.7% | 61.9% | |
Source: U.S. Bureau of Labor Statistics, the U.S. Census Bureau and author’s calculations
So, Indiana has about 3.2 million working citizens, another 1.14 million nonworking citizens (unemployed or out of the labor force), and another 920,000 who are of retirement age. It is estimated that 10 million Americans are taking opioids, and 2 million of them are likely to be addicted.7 Given that 2 percent of the U.S. population (16+) lives in Indiana, and given that Indiana would be considered a “middle of the road” heroin-use state (we rank 26th),8 then we can estimate that 204,051 Hoosiers take opioids, and 40,810 of these are addicted. Total misuse of opioids by Hoosiers would likely fall between these two numbers. In fact, the Substance Abuse and Mental Health Services Administration (SAMHSA) reports that 1.4 percent of the American population above 12 years (or 18 years—the numbers are equal) are opioid misusers.9 Given the Indiana (16+) population of 5,239,077, we estimate 73,347 opioid misusers in Indiana.
The rate of unemployment is 389 percent higher among opioid misusers.10 Indiana has an unemployment rate of 3.8 percent (as of September 2017). A question remains as to what extent the opioid epidemic includes the population outside of the labor force, which is a pre-retirement age population of 990,833 people. Adding in the 151,126 unemployed, for a total of 1,141,959 non-employed Hoosiers, we can estimate the total non-employment rate in Indiana. The total Indiana non-employment rate is 1,141,959/(5,239,077 – 919,876), or 26.4 percent. Furthermore, the percentage of opiate misusers estimated to be among the full-time and part-time workforce is 57.5 percent, while the percentage of opiate misusers estimated to be among the unemployed is 11.9 percent, and the percentage of opiate misusers estimated to be out of the labor force is 30.6 percent.12 So, 42.5 percent of opiate misusers are among the non-employed.
We can then estimate the number of opiate misusers among the non-employed: 0.425 x 73,347, or 31,173, or about 2.7 percent of the total non-employed. With a larger proportion of misusers skewed toward the non-employed group, Indiana becomes less attractive for future employment growth, particularly in a relatively tight labor market.
Estimated economic losses to Indiana from the opioid epidemic
While the opioid epidemic has been socially important through its entire duration, this problem now threatens to erode growth in economic output. Because the labor market in Indiana has tightened to a critical point, finding fit workers available to fill open positions is now a key challenge. Indeed, further economic growth depends upon some combination of gains in employee productivity and job growth.
In 2017, nearly 25 percent of job applicants nationwide failed drug tests, and the rate of opioid overdose deaths in Indiana increased from 2015 to 2016 by 52 percent.
Because our state is heavily manufacturing oriented, our recipe for GSP growth has historically included job growth. However, this epidemic has resulted in thousands of Hoosiers disabled and/or incarcerated, with many experts stating the epidemic is still on the rise. For instance, in 2017, nearly 25 percent of job applicants nationwide failed drug tests, and the rate of opioid overdose deaths in Indiana increased from 2015 to 2016 by 52 percent.13
Three levels of economic losses can be conceptualized regarding the opioid epidemic.
- The direct measure of GSP loss is important. This includes the effects on the participants in the labor force (where the unemployment rate is measured) and the effects of the nonparticipants in the labor force.
- Services consumed by opioid emergencies yield opportunity cost.
- Some part of the population of opioid users who are still “actively employed” are still receiving paychecks and still consuming products and services, but their productivity at their jobs is likely suffering, thus reducing output by some measure.
In this paper, we focus only on the direct output loss.
Direct losses to output
To calculate the labor force effects, initially, the participants in the labor force were considered. Opioid users were categorized into educational levels, which correspond to median weekly earnings.14 Using a population ratio between the U.S. and that of Indiana, the estimated numbers of opioid users in Indiana at each earnings level was then calculated, and earnings were summed. This number includes the total opportunity set of median annualized earnings by all opioid misusers in Indiana.
To adjust for employment, the national unemployment rate for opioid misusers was compared to the general unemployment rate for Indiana during the same period (2016).15 The unemployment rate for opioid users was 17.1 percent in 2016, while the unemployment rate in Indiana at the end of 2016 was 4.4 percent.16 Thus, opiate misusers were unemployed at a rate 389 percent higher than the general population. Moreover, while the rate of opiate use has reportedly increased in 2017 and the Indiana unemployment rate has decreased to 3.8 percent, this “opioid unemployment ratio” could be reasonably estimated at 450 percent.
To account for the lost earnings, the general unemployment rate is subtracted from the opiate unemployment rate, and the corresponding difference multiplied by the total opiate-affected wages. Finally, GSP is estimated by application of a ratio, covering seven years through the recovery (2010-2016), which converted the product of total Indiana state quarterly wages and total Indiana jobs at each point into Indiana GSP output.17 That ratio over the 2010-2016 time span was 2.612.
Estimates for total opiate-misusers in Indiana range from 66,491 to 74,792. Thus, the total opiate-affected wages across educational strata is estimated to range from $2.68 billion to $3.02 billion. Applying the GSP multiplier we have, the direct GSP loss estimates range from $890 million to $1.05 billion.
- Low-range direct opioid Indiana GSP loss = $2.681B x (0.1712 – 0.0440) x 2.612 = $890 million
- High-range direct opioid Indiana GSP loss = $3.016B x (0.1712 – 0.0380) x 2.612 = $1.05 billion
The effective reduction in available labor force is a second component of estimating the GSP loss to the Indiana economy from opioid misuse. CNN reported that among 1.8 million workers out of the labor force nationally for “other” reasons, approximately 48.9 percent of them surveyed reported having used opiates the day before.19 This yields an opiate-affected group of 881,000 across America who are out of the labor force, hypothetically due to opioid misuse. When applying the Indiana and U.S. population numbers, it is estimated that 18,052 Hoosier workers are out of the labor force (thus, not counted as “unemployed”) and part of the opioid epidemic.20 Taken that about 25 percent of these cases are misusers and unable to contribute gainfully to the economy because of opioid misuse, we reduce this number of Hoosiers to 4,513.21 Multiplying this raw number by the average annual wages in Indiana of $46,020 (as of 2016), we arrive at $207,688,260. Multiplying by 2.612 gets us to an estimate of GSP, which in this case is about $542 million, or about 16 percent of Indiana GSP.
Therefore, the combined direct estimate of GSP lost in Indiana currently is approximately $1.5 billion annually, and potentially this number is on the rise. With Indiana having a total GSP output of $341.9 billion, the opioid epidemic reduces output by 0.44 percent.
Another way of thinking about the direct loss is to consider that approximately 9,000 Hoosiers are currently participants in the labor force and could work gainfully in Indiana, adding value to our state, and yet they are fully unemployed because of the opioid crisis. Adding to this are an additional 4,500 Hoosiers who, but for opioid misuse, would be participants in the Indiana labor force. This translates directly into what would be three massive manufacturing plants equivalently not operating in our state because of opioids. Each missing factory would employ 4,500 Hoosiers at various educational and skill levels, resulting in $1.5 billion in additional GSP.
Perhaps of most concern, the opiate usage rates have been trending upward, based on current data collected and shared by the Centers for Disease Control.22 This poses an additional threat to GSP growth going forward—in any area experiencing conditions at or near full employment. Also, this brief estimate assumes that all remaining opiate users (not misusers) are fully productive members of the total workforce, which may overstate their current or future productivity.
Indirect losses to output
Beyond the losses in available workforce and the corresponding reduction in output, additional losses to Indiana GSP include the services opioid misusers consume that would otherwise have been available for other needs. This results in either service losses or service redundancies. While this does not directly affect GSP, it does affect the quality of services Hoosiers receive while living in Indiana. Furthermore, numerous reports indicate infants are born addicted to opiates, leading to poor health outcomes—again not a current GSP loss.23 Finally, another indirect cost associated with the opioid crisis is the negative branding and stigma associated with living in a state known for its higher-than-average levels of drug misuse, addiction, incarceration and death.
In 2015, total drug-related overdose deaths were highest in West Virginia, wherein 39.3 deaths occurred per 100,000 people. New Hampshire was second at 31.7 deaths per 100,000, followed by Rhode Island at 29.3, Kentucky at 28.8, then Ohio at 28.5. Indiana ranked 17th in the country in drug deaths with 18.8 deaths per 100,000 citizens.24 Adjacent to Kentucky and Ohio, Indiana is geographically positioned along a corridor of overdose deaths and meth labs. Of course, this is not good for the state on several levels.
Economically, given Indiana’s ultra-low unemployment rate, aging population, high incarceration rate, and already increased labor participation rate, the drug issues in Indiana are of particular concern. Indiana employers are having difficulty finding workers quickly enough to support full economic growth, and opioids and amphetamines exacerbate this problem. One silver lining for Indiana is that the number of opiate prescriptions per capita peaked in 2012, although Indiana still ranks 11th out of 50 states in terms of most opiates prescribed per capita.25 To combat this ranking, a new law in Indiana limits opiates prescribed by licensed practitioners to not more than a seven-day supply for first-time users or for those under 18 years old.26 However, the dark side of this policy is that addicts who can no longer acquire prescription pain medications often turn to heroin, where results can be deadly, placing further pressure on Hoosier communities.27
Discussion: Additional drugs of concern
While the focus of this article is to estimate the lost economic value associated with opioid misuse, the addictive and deadly drug crisis could be thought to include people who are misusers of other illicit drugs, such as methamphetamines.28 According to Drug Enforcement Administration published records, Indiana leads the nation in “meth lab incidents.”29 While methamphetamines are an important social problem, some information suggests consumption rates have been dropping nationwide.30
Nevertheless, expanding a bit on methamphetamines in Indiana may provide context suggesting this issue warrants its own study. For instance, in 2014, Indiana sustained 1,471 meth lab incidents, by far the highest incident rate among any state in the nation. Missouri came in second with 1,034 meth lab incidents.31 Many resources exist describing the frightening dangers methamphetamines pose to human life, and how badly it makes users look and feel.
Discussion: Opioid effects across America
Because of the differences in labor market measurements, economic effects of opiate misuse can be expected to cost more per capita in Indiana versus across the entirety of America. However, further investigation may be warranted when considering other states where, like in Indiana, a “perfect storm” has been gathering fueled by conditions of increasing age, lowering unemployment, increasing labor force participation, and considerable misuse of prescription opioids and heroin.
Figure 1 graphically presents some states where unemployment rates are lowest, demarcated by lighter shading. States of interest include Colorado, North Dakota, South Dakota, Nebraska, Kansas, Oklahoma, Iowa, Missouri, Arkansas, Indiana, Virginia, North Carolina, South Carolina, Vermont and New Hampshire.
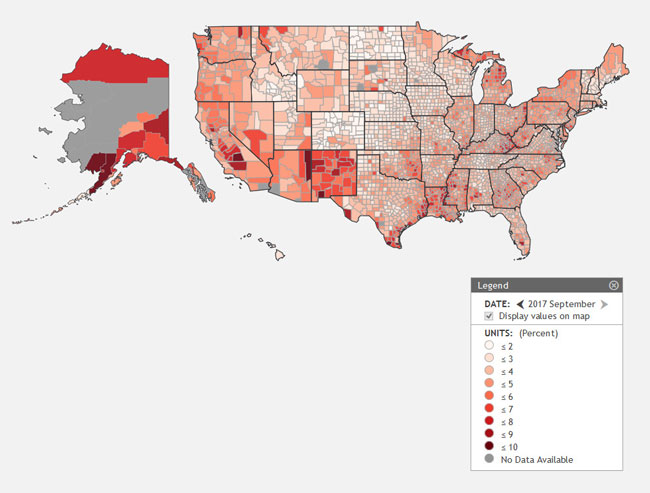
Simultaneously considering a national map of drug overdose deaths (see Figure 2) can provide us with a band of states that—like Indiana—might be experiencing headwinds to GSP growth attributable in part to the opiate epidemic. In this map, darker shading suggests more overdose deaths per capita over the period.
Figure 2: Drug overdose deaths across America, 2012 to 2014
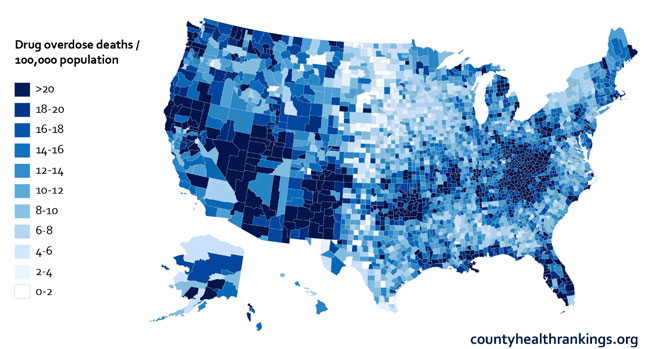
Visually, it is clear from the maps above that geographic locations having higher unemployment rates are associated with higher rates of drug overdose deaths, which is concerning on an individual basis, as well as for the socio-cultural health of these communities. It would make sense to estimate GSP losses due to statewide opioid misuse for the following states beyond Indiana: Colorado, Oklahoma, Missouri, Arkansas, North Carolina, South Carolina, Vermont and New Hampshire.
Conclusion
This article is not singling out Indiana as a lone laggard among states in a nation otherwise free from economic or social ills. Hardly. All states are suffering from opioid misuse, and for some states where tight labor markets intersect with higher opiate misusage rates, it is suggested that similar GSP loss analyses could be assessed to help leaders there better understand the scope of the crisis from an economic lens. For the present study, Indiana is susceptible to reductions in GSP growth expectations because Indiana has a relatively low unemployment rate combined with a relatively high labor force participation rate among peer states—and Indiana has experienced considerable opioid misuse incidents. Confronting these challenges effectively and boldly yields the potential for additional economic growth.
Notes
- 2015 year-end numbers from the Bureau of Justice Statistics taken on October 26, 2017 from www.bjs.gov/index.cfm?ty=kfdetail&iid=488.
- J. Keller and A. Pearce, “This Small Indiana County Sends More People to Prison than San Francisco and Durham, N.C., Combined. Why?” New York Times, September 2, 2016, www.nytimes.com/2016/09/02/upshot/new-geography-of-prisons.html.
- See note 1.
- J. Leinhoop, Mayoral address to the Alliance for Substance Abuse Progress meeting at the Columbus, Indiana Commons, on October 25, 2017. Reported by The Republic, October 26, 2017.
- See note 4.
- S. Nasiripour, “Which Industries Lost/Gained Jobs in the Great Recession (CHARTS)?” The Huffington Post, June 5, 2010, www.huffingtonpost.com/2010/04/05/which-industries-lostgain_n_525504.html.
- J. Korzenick, “2018 Economic Forecast,” Fifth Third Bank. Presentation delivered on October 25, 2017.
- Substance Abuse and Mental Health Services Administration (SAMHSA), “National Surveys on Drug Use and Health 2015: Survey of People Age 12 and Older Whether They Used Heroin within the Past Year,” www.samhsa.gov/data/sites/default/files/NSDUHsaeTotals2015A/NSDUHsaeTotals2015.xlsx.
- See note 8.
- Substance Abuse and Mental Health Services Administration (SAMHSA), “National Surveys on Drug Use and Health 2016,” www.samhsa.gov/data/sites/default/files/NSDUH-DetTabs-2016/NSDUH-DetTabs-2016.htm#lotsect1pe.
- See note 10.
- According to SAMHSA (2016), 4.8 percent of misusers are 65 and older, and this data includes all age groups. Therefore, the data is slightly skewed as we are concerned in this study with working-age populations. Effects for correcting this are estimated to be de minimis.
- M. Webber, “Panel Discusses Next Steps to Battle Opioid Epidemic,” The Republic, October 26, 2017, print edition.
- U.S. Bureau of Labor Statistics data taken on October 31, 2017 from www.bls.gov/webapps/legacy/cpswktab5.htm.
- See note 10.
- See note 10.
- U.S. Bureau of Labor Statistics, Quarterly Census of Employment and Wages data reported by STATS Indiana. Taken on November 1, 2017 from www.stats.indiana.edu/cew/.
- Author's calculation. Applies educational strata and corresponding weekly wages with information about opioid misusers by age group and demographic characteristics tabulated by the Department of Health and Human Services (Table 1.66A). Also applies an opioid misuse inflation factor to adjust to 2017 value. Demographic data on opiate misusers taken on October 31, 2017 from www.samhsa.gov/data/sites/default/files/NSDUH-DetTabs-2016/NSDUH-DetTabs-2016.htm#lotsect1pe.
- P. Gillespie, “The Opioid Crisis Is Draining America of Workers,” CNN Money, July 27, 2017, https://www.ndwa.org/news/the-opioid-crisis-is-draining-america-of-workers/.
- This population likely constitutes a mix of opioid users who were already out of the labor force, as well as prior workers who left the labor force because of opioid abuse.
- The national addiction rate of opiate users is 20 percent. Twenty-five percent is applied here reflecting the additional likelihood that misuse is marginally more common among those who are not counted among the active labor force.
- Centers for Disease Control, “Drug Overdose Death Data.” Taken on October 26, 2017 from www.cdc.gov/drugoverdose/data/statedeaths.html.
- M. Groppe, “Data Show High Rate of Opiate-Affected Newborns,” Indianapolis Star, August 13, 2016, www.indystar.com/story/news/2016/08/13/data-show-high-rate-opiate-affected-newborns/88561134/.
- See note 22.
- Centers for Disease Control, “U.S. Prescribing Rate Maps, 2006-2016.” Taken on November 5, 2017 from www.cdc.gov/drugoverdose/maps/rxrate-maps.html.
- Indiana State Medical Association, “Indiana Pain Management Prescribing Final Rule.” The law took effect on July 1, 2017. See www.ismanet.org/pdf/legal/IndianaPainManagementPrescribingFinalRuleSummary.pdf.
- S. Gupta, “Unintended Consequences: Why Painkiller Addicts Turn to Heroin,” CNN, June 2, 2016, www.cnn.com/2014/08/29/health/gupta-unintended-consequences/index.html.
- National Institute on Drug Abuse, "What Are the Long-Term Effects of Methamphetamine Abuse?": Methamphetamine Research Report Series, www.drugabuse.gov/publications/research-reports/methamphetamine/what-are-long-term-effects-methamphetamine-abuse.
- U.S. Drug Enforcement Administration, "Methamphetamine Lab Incidents, 2004-2014," .
- National Institute on Drug Abuse, "What Is the Scope of Methamphetamine Abuse in the United States?" Methamphetamine Research Report Series, www.drugabuse.gov/publications/research-reports/methamphetamine/what-scope-methamphetamine-abuse-in-united-states.
- See note 29.
