Indiana’s outlook for 2018

Associate Professor of Finance, Indiana University Division of Business, Indiana University–Purdue University Columbus
Groundhog Day
In the 1993 movie Groundhog Day, the character known as Phil Connors (played by Bill Murray) is stuck in a time loop, which proceeds to repeat the events of February 2 every day, over and over.
As Connors continues to repeat February 2, he struggles to find meaning deriving from the normal utilitarian activities we economists like to measure in terms of monetary value. Such has been the feeling of our economic recovery here in Indiana. In each period of this decade, we have continued to slog along seeing tepid growth and modest gains, as if we Hoosiers have been cast as stars in another movie about Groundhog Day, this one teasing viewers about the frustrations of seemingly endless subpar economic growth. Now well into its ninth year, our recovery from the Great Recession continues to replay each year with economic news much like that of the last year—slow, and generally unimpressive, as recoveries go. The question remains, will Indiana break out of the slow growth cycle?
For 2018, we expect to see growth between 2.0 percent and 2.8 percent. Whether we end up near the higher end of the scale or the lower end (another economic Groundhog Day) depends on several external factors, such as U.S. tax reform, Federal Reserve action, free trade agreements, immigration labor policies, international stability and inflation, as well as other factors more within the control of Hoosier leaders.
Although recent years have produced slow economic growth without much variance, growth experienced during the recovery here in Indiana certainly has not knocked us out of our economic socks. In spite of our slow growth, Indiana’s numbers have generally compared favorably to those of other states. Over the last seven years (2009 to 2016), Indiana’s seven-year growth in chained-dollar, or “real,” gross domestic product (gross state product, or GSP) has ranked 15th in the country at 14.7 percent (2.0 percent annual growth), according to the U.S. Bureau of Economic Analysis. The U.S. leader over the period has been North Dakota, with 46.6 percent real growth achieved over the seven-year period—but it’s difficult to compete with oil shale fields and a new oil pipeline. Second place goes to Texas at 28.5 percent, again with energy leading the way alongside technology. In third place, Oklahoma came in at 21.9 percent, far surpassing the national average of 14.1 percent—a number heavily skewed by the behemoths of Texas and California, which sustained 20.3 percent growth on the backs of technology and many other industries located there.
Among our 10 peer states who are either heavy manufacturers, neighboring states or both, Michigan comes in first with a seven-year GSP growth of 18.6 percent. Ohio was second at 15.2 percent, and Iowa at 15.1 percent. Indiana was fourth (14.7 percent), followed by Oregon (14.4 percent), Wisconsin (11.5 percent), Kentucky (10.7 percent), North Carolina (10.3 percent), Illinois (8.5 percent) and Louisiana (-2.5 percent).
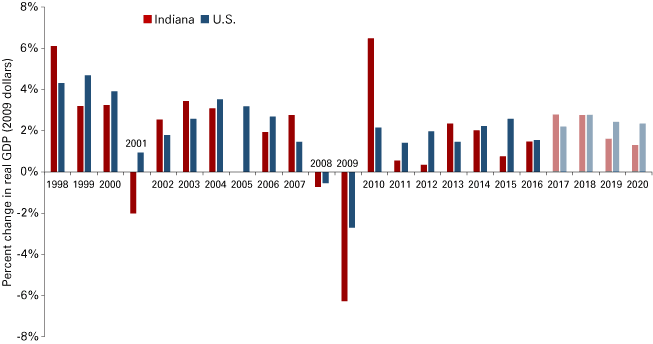
In terms of GDP (or GSP) growth, econometric forecasting for 2017 indicates Indiana will finish the year with 2.8 percent growth, while the U.S. is expected to see 2.2 percent. That same model suggests Indiana will see 2.8 percent growth in 2018, slightly ahead of growth expectations in the U.S. However, September numbers from the Midwest Economy Index suggest growth in Indiana slowed overall, with consumer spending, mining and construction activity all decreasing, while manufacturing activity ticked up slightly.1 In the sections that follow, we will address some of the information used to arrive at our final forecast leading into 2018.
GDP growth
The year 2016 ended up as economically uninteresting as it was politically interesting. That year, Indiana and the U.S. both achieved lukewarm growth results of 1.5 percent. Coincident with a national political focus on deregulation,2 economic outputs nationwide and in Indiana have improved in 2017. Led by a banner year in automotive sales and other manufacturing output, Indiana’s economy is poised to outpace the U.S. economy in 2017 for just the second time in seven years. Figure 1 shows the relationship between annual Indiana GSP growth and the U.S. yearly growth in GDP since 1998. We expect Indiana’s annual rate of real (i.e., inflation-adjusted) GSP growth in 2017 to be 2.8 percent.
Figure 1: Annual change in GSP and U.S. GDP
Note: Data for 2017-2020 are projections.
Source: U.S. Bureau of Economic Analysis and the Indiana University Center for Econometric Model Research
Background on GDP (GSP)
GDP/GSP can be measured using any one of three approaches: the sum of expenditures, the income approach or the value-added approach.3 In the value-added approach, upon which we rely for this analysis, intermediate input costs are taken from total sales. In this approach, all sales and costs can be attributed to government activity or private sector activity and can be separated into distinct industries.
In Indiana, the lion’s share of GSP aggregates from compensation and returns to capital generated by the various industries across the state, each having a unique performance profile, with government in our state taking a small share of total output. In 2015, the private sector of the Hoosier state accounted for 91 percent of economic activity, while the government comprised the other 9 percent.4 As a comparison, the United States’ private sector measured at 88 percent of total output, with government expenditures coming in at 12 percent, implying government's share of economic activity for the U.S. as a whole is 33 percent higher than the level of government in Indiana.5
In fact, Indiana ranks first in the nation in this way at 91.0 percent of GSP attributable to the private sector. Pennsylvania follows in second place at 90.4 percent private, with Delaware at 90.3 percent, Illinois at 90.2 percent and Minnesota at 90.2 percent. Predictably, the District of Columbia comprises the largest component of government output among all U.S. regions with its private sector coming in lowest of all, at 65.9 percent. The most government-loaded states are New Mexico (77.8 percent private), Hawaii (78.4 percent private), Maryland (79.5 percent private), Alaska (81.4 percent private) and Virginia (81.7 percent private).6
Indiana’s private sector runs broadly on manufacturing (31.8 percent), followed by financial services (16.4 percent), professional and business services (9.2 percent), health care (8.8 percent), retail (6.7 percent), wholesale (6.1 percent), construction (4 percent), arts/entertainment/recreation/food services (3.8 percent), transportation and warehousing (3.6 percent), information/media (2.3 percent), utilities (2.0 percent), agriculture (1.3 percent), education (1.0 percent), mining (0.6 percent), and other services (2.4 percent).7
Movers and shakers by industry
Starting with the bad news, agriculture expects to be down 19 percent for 2017, yet also expects to rise by 2.1 percent in 2018. It is worth noting that agriculture was up 20.7 percent in 2016. As mentioned above, agriculture comprises only 1.3 percent of the total economy of Indiana, so the impact of rises and falls in this sector may not be material on the whole. Other sectors expecting to see real negative growth include information (this includes publishing, motion pictures, broadcasting, telecommunications and internet publishing), which expects to see a 0.7 percent decline in 2017 followed by a 0.4 percent decline in 2018, as well as education, which expects to see a 1.0 percent decline in 2017 followed by a 1.6 percent increase in 2018.8
A risk for economic growth in Indiana is that durable goods manufacturing is expecting to see headwinds through 2018, as we approach what some feel will be a plateau in North American auto and light truck sales.9 Buoyed by robust new car and light truck sales increases between 2010 and 2016, the recovery from the Great Recession in Indiana has been supported, with steady increases all decade, leading to nearly 17.6 million auto units sold in 2016, representing the highest number of units sold in history.10 Forecasts for 2017 and 2018 auto sales in the U.S. are mixed. Forecasts from auto industry experts prior to the recent hurricane season expected to see declines in new car and light truck sales this year and next. Yet, with a hurricane effect bump arising from the roughly 500,000 cars and trucks that were destroyed by Hurricane Harvey in Texas in summer 2017, this industry expects to gain traction.11 Annualized September 2017 sales numbers in the U.S. were 18.9 million, yet this is, of course, unsustainable.12 The temporary sales increase should materialize between September and December 2017, and somewhat during the first part of 2018, as damaged cars are replaced. The record level of sales in the U.S. in 2016 may ultimately be the automotive plateau some have been suggesting,13 while 2017 numbers are expected to be less, in spite of the hurricane bump. The nearly decade-long auto sales expansion is finally beginning to show some signs of age and higher mileage.14
Overall, durable goods manufacturing in Indiana in 2015 produced $51 billion in output. Automotive constitutes about $19 billion of that total output, with additional products including primary metals, fabricated metal products, machinery manufacturing, and computer and electronics manufacturing also being significant contributors.15 With Hondas, Toyotas and Subarus built in Indiana, as are parts for many other automakers, even as car type and propulsion types change, this important part of our economy should be reasonably stable as we move through 2018, even if it is not expected to grow.16
The pharmaceutical industry is expected to grow nationwide in 2017 and 2018, and on through the end of the decade by an annualized rate of 6.5 percent.17 With total output of $21.3 billion, this part of the economy is quite important. Indiana is positioned to participate in this growth with its noteworthy portfolio of life sciences companies, yet some turbulence would not be unexpected depending on the remaining useful life of patents, drug trials and other idiosyncratic conditions individual firms commonly face, regardless of whether the industry itself is expanding.
Employment
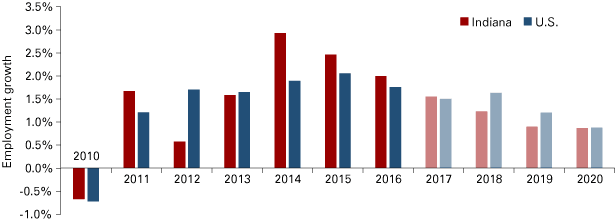
On October 24, 2017, it was reported that a newly planned Toyota-Mazda plant will not be built in Indiana. This lost opportunity cost was reported to be a $1.6 billion initial investment along with 4,000 new jobs.18 The two reasons cited by Toyota and Mazda for excluding Indiana from the short list include (1) the possibility of stealing Toyota workers from Princeton or Columbus, and (2) the current low unemployment rate in Indiana makes it a challenge to find workers. Of course, additional, unspecified reasons are likely responsible in part for their decision, yet the risk is clear: Attracting new opportunities for additional job growth becomes more difficult as the labor market tightens. For some economists, we are at or near full employment now.19 Fueling the dropping unemployment rate has been strong employment growth, which has outpaced national employment growth for what is expected to be five out of the last seven years, resulting in 386,000 more employed Hoosiers since 2010 when we emerged from the Great Recession.20
The disconnect between the Hoosier GSP growth (only beat the U.S. in two of the last seven years) and Hoosier employment growth (beat the U.S. in five out of seven years) is explained below in the “education and per capita income” section. In that section, a case is made for Indiana’s historical reliance on (relatively lower-paying) manufacturing and the corresponding lack of attracting more (relatively higher-paying) service jobs requiring higher educational attainment, which has led to Indiana falling behind in GSP growth.
Ultimately, as auto sales approach peak outputs this year or next, even with considerable manufacturing density here, job growth nationwide is expected to eclipse Hoosier job growth as we transition into the coming decade (see Figure 2).
Figure 2: Annual employment growth with model forecast
Note: Data for 2017-2020 are projections.
Source: U.S. Bureau of Labor Statistics and the Indiana University Center for Econometric Model Research
Labor force, population and age
Indiana maintains its position as #1 nationally in percentage of GSP earned via manufacturing, as well as the highest employment share in manufacturing in the U.S., coming in ahead of our peer states in the surrounding region, as well as North Carolina, Oregon, Iowa and Louisiana—all of which taken together round out the top 10 in manufacturing volume across the country. To assess how Indiana compares to these states, we can look at comparative unemployment rates over the prior five years, as shown in Table 1.
Table 1: September unemployment rates for Indiana and peer manufacturing-heavy states
| 2013 | 2014 | 2015 | 2016 | 2017 | |
|---|---|---|---|---|---|
| U.S. | 7.2% | 5.9% | 5.0% | 4.9% | 4.2% |
| Indiana | 7.1% | 5.7% | 4.6% | 4.3% | 3.8% |
| Illinois | 8.9% | 6.5% | 5.9% | 5.8% | 5.0% |
| Iowa | 4.5% | 4.2% | 3.8% | 3.6% | 3.2% |
| Kentucky | 8.0% | 5.8% | 5.2% | 5.0% | 5.2% |
| Louisiana | 6.2% | 6.8% | 6.0% | 6.1% | 5.1% |
| Michigan | 8.5% | 6.7% | 5.1% | 5.0% | 4.3% |
| North Carolina | 7.4% | 6.0% | 5.6% | 5.1% | 4.1% |
| Ohio | 7.3% | 5.4% | 4.7% | 5.0% | 5.3% |
| Oregon | 7.5% | 6.6% | 5.5% | 4.9% | 4.2% |
| Wisconsin | 6.5% | 5.1% | 4.5% | 4.2% | 3.5% |
Note: Data are seasonally adjusted.
Source: U.S. Bureau of Labor Statistics
We see that as of September 2017, Indiana had a lower unemployment rate (3.8 percent) than the nation (4.2 percent), and Indiana’s unemployment rate stood lower than its peer states, except Wisconsin (3.5 percent) and Iowa (3.2 percent). However, unemployment rates only tell part of the employment story in a given region. Other parts of the story include the age of the population, the percentage of the population who participate in the labor force and the educational attainment level of the residents.
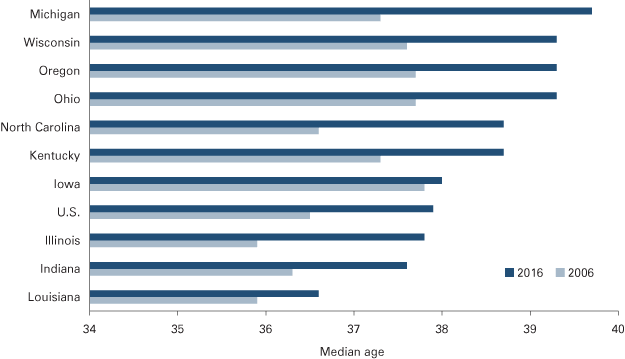
To the first point about age, Indiana is a relatively young state (see Figure 3). This statistic could be dismissed without much further thought. However, in terms of attracting new business and generating future production from a workforce, Indiana offers a relative advantage among the manufacturing leaders. That said, we also notice that all of the peer states are “getting older,” which presents a concern about our workforce fitness going forward.
Figure 3: Median age among peer manufacturing states: 2006 versus 2016
Source: U.S. Census Bureau
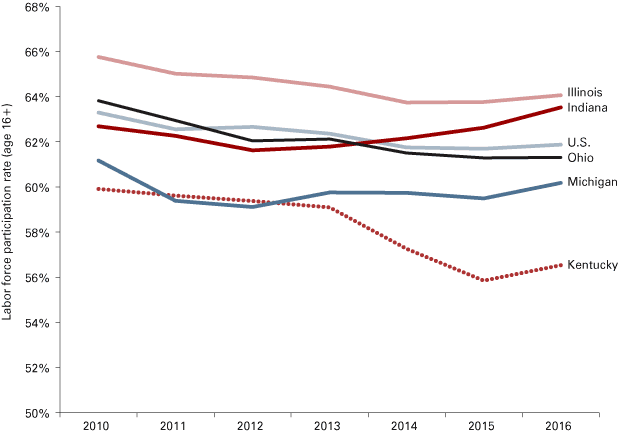
The second point addresses the issue of labor force participation, which we analyzed over a six-year period (2010-2016). What we see in Figure 4 is that since 2012, Indiana has trended upward in terms of expanding its labor force as a percentage of its total adult population. Thus, when considering the unemployment rate at 3.8 percent (any level, really), we couch that in terms of the numbers of Hoosiers formally seeking employment. Taken together—a falling unemployment rate and an expanding labor force—this is a good sign that Indiana has been working hard.
Figure 4: Labor force participation among neighboring states
Note: Data are seasonally adjusted.
Source: U.S. Bureau of Labor Statistics and U.S. Census Bureau, October 2016
However, alongside advancing age, we now have the potential for an economic storm on the horizon, which could result in another Groundhog Day—one that could lower growth expectations and cast away any happy ending we may have to our story. Further, we also see that other peer states have begun to also swing upward in labor force participation, and that the U.S. as a whole has inflected upward to a rate of about 62 percent in 2016, and perhaps 63 percent as of 2017. Yet, while labor force participation has been on the rise, the duration of unemployment has been longer than during past business cycles, explained in part by advancing age—perhaps physical fatigue—and obsolete skill sets.21
Will we break out of the time loop?
Last year, we said we expected slow growth, much like the years before. And that is what we ended up with—1.5 percent in terms of GSP. Is an aging workforce holding Indiana back from surging forward nationally in GSP growth? What about the increasingly tight labor market—tighter in Indiana than most places? Is it population growth that we need to be more attractive as we near full employment? Clearly, we need to find and develop indigenous and immigrant workers, to attract jobs suitable to our (hopefully improving and increasingly productive) workforce, to drive production, and to drive the economy forward.
Two areas of intra-state concern enter the discussion as we continue our analysis: (1) the opioid epidemic and (2) the persistently low ranking among states in higher educational attainment.
The opioid epidemic is more fully explored in the article, “The economic impact of opioid misuse in Indiana,” also in this issue. Considering proactive policies to combat the opioid epidemic (as well as the war on nonviolent crime and its associated high incarceration rate in Indiana) may yield an opportunity to improve the Indiana labor force. In Bill Murray’s 1993 blockbuster, the way out of the time loop ultimately was for Phil Connors to serve his community, which speaks to our possible approach to solving the opioid problem, which now threatens to slow GSP growth in Indiana.
A second area of concern is that Hoosiers need to continue to focus on becoming better educated, moving more Hoosiers into higher earning brackets and—importantly—into more recession-friendly employment outlets. Indiana continues to suffer from a gap in higher educational attainment, which hurts Indiana’s per capita income.
Education and per capita income
When earnings rise, GSP rises as well. A corollary is that when earnings don’t fall, GSP doesn’t fall either. It turns out that populations having a higher proportion of baccalaureate-educated citizens earn more money, and are more likely to keep their jobs during a contraction at the end of a business cycle. Last year, we looked at a nine-state region—Indiana’s peer manufacturing powerhouses—over an 11-year period (annual data) for each state, regressing personal income on baccalaureate attainment. Results suggested that for every percentage increase in baccalaureate attainment in a given state’s population, that state’s per capita personal income (PCPI) rises by about $713 in the following year. The relationship was strong, with 79 percent of the variance in income level explained by educational attainment level and a t-stat greater than 10.
This year, the analysis was expanded to include all 50 states over 11 years (again, annual data) to see if the results would be confirmed or confounded. Alas, the results were confirmed. In the updated study expanded to include all 50 states, results suggest that a state can expect to earn $965 more per capita each year versus a peer state with 1 percent fewer baccalaureate-educated adult citizens (ages 25 and older). The study did not address differential unemployment rates between educated and uneducated populations during the most recent recession.
Table 2: Baccalaureate attainment and its association with personal income—Regression results
| Coefficient | Robust standard error | t-statistic | p-value | |
|---|---|---|---|---|
| Baccalaureate attainment | $965.49 | 50.66 | 19.06 | 0.000 |
| Year effects removed? | Yes | |||
| Adj. R-squared | 0.601 | |||
| Observations | 550 | |||
| Number of states | 50 | |||
| Number of years | 11 |
Source: R. Brewer at Indiana University–Purdue University Columbus. Data taken from the U.S. Census Bureau and the U.S. Bureau of Labor Statistics in October 2017.
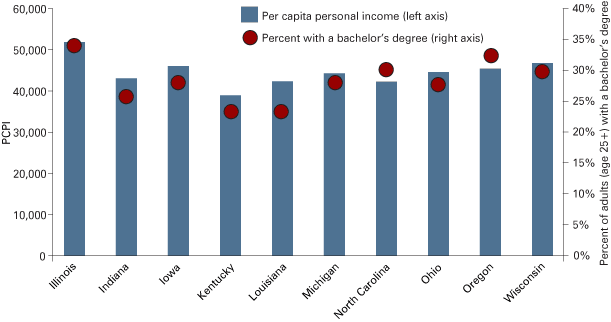
Figure 5 depicts the strong association between level of higher education and level of personal income, for Indiana’s peer states who are also positioned heavily in manufacturing. Therefore, education also works to drive income—and thus GSP—including in states who depend heavily on manufacturing.
Figure 5: Baccalaureate attainment (2016) and PCPI (2015)
Source: R. Brewer of Indiana University–Purdue University Columbus. Data taken from the U.S. Census Bureau and the U.S. Bureau of Labor Statistics in October 2017.
This implies that a more highly educated workforce makes more money, even in manufacturing states like Indiana. The U.S. Census Bureau, as of 2015, ranked Indiana 42nd out of 50 states on baccalaureate attainment. As of 2016, Indiana remained at 42nd. Not good.
Among the states in the manufacturing peer group, only Kentucky and Louisiana had lower percentages of four-year college graduates (see Table 3). Consequently, we notice an opportunity to turn up the dial in Indiana for future GSP improvement with a focus on continued higher educational development of Hoosiers.
Table 3: Baccalaureate attainment in the Manufacturing Belt
| 2006 | 2012 | 2013 | 2014 | 2015 | 2016 | |
|---|---|---|---|---|---|---|
| U.S. (Mean) | 27.0 | 29.1 | 29.6 | 30.1 | 30.6 | 31.3 |
| Massachusetts (High) | 37.0 | 39.3 | 40.3 | 41.2 | 41.5 | 42.7 |
| West Virginia (Low) | 16.5 | 18.6 | 18.9 | 19.2 | 19.6 | 20.8 |
| Illinois | 28.9 | 31.6 | 32.1 | 32.8 | 32.9 | 34.0 |
| Oregon | 27.5 | 29.9 | 30.7 | 30.8 | 32.2 | 32.7 |
| North Carolina | 24.8 | 27.4 | 28.4 | 28.7 | 29.4 | 30.4 |
| Wisconsin | 25.1 | 27.1 | 27.7 | 28.4 | 28.4 | 29.5 |
| Iowa | 24.0 | 26.3 | 26.4 | 27.7 | 26.8 | 28.4 |
| Michigan | 24.5 | 26.0 | 26.9 | 27.4 | 27.8 | 28.3 |
| Ohio | 23.0 | 25.2 | 26.1 | 26.6 | 26.8 | 27.5 |
| Indiana | 21.7 | 23.4 | 23.8 | 24.7 | 24.9 | 25.6 |
| Kentucky | 20.0 | 21.8 | 22.6 | 22.2 | 23.3 | 23.4 |
| Louisiana | 20.3 | 22.0 | 22.5 | 22.9 | 23.2 | 23.4 |
Source: U.S. Census Bureau
Other concerns and issues
Risks: Additional risks to growth in Indiana might include:
- Interest rates rising too quickly, jeopardizing attractive lease rates on new automobiles and light trucks.
- Irresponsible immigration policy changes, threatening the availability of productive workers as employers find their demand for labor (especially skilled labor and STEM positions) go unfilled—increasing the chances of employers’ relocation out of state.
- Irresponsible changes to NAFTA, challenging the efficiency of cross-border trading partners and currently preferred supply chains, particularly in the automotive sector.
- Lack of willingness of leaders to think creatively in searching for solutions to unconventional problems—solutions that can lead to GSP growth.
Upside: Constructive tax reform and continued government regulations streamlining could present upside GSP growth, particularly if taxes are differentially favorable here in Indiana versus competing states (for jobs and for new residents). Health care reform or modernization could have an additional effect, although little optimism exists that any such change will be made over the coming year.
Conclusion
Indiana is generally on track for economic growth in 2018, likely somewhere between 2.0 percent and 2.8 percent.
To avoid another Groundhog Day of slower growth near the pessimistic end of the forecast range, Indiana leaders may want to consider the following concerns:
- Indiana is heavily invested in automotive production, and many experts believe new auto and light truck sales are poised to achieve slow to near zero growth in 2018.
- Indiana appears to be approaching full employment, discouraging optimism for sufficient labor force growth to keep pace with demand.
- The current opioid epidemic threatens to exacerbate jobs growth given already tight labor markets across Indiana. For the full analysis of this important topic, see the article, “The economic impact of opioid misuse in Indiana.”
- Indiana income growth is predicated on increasing its focus on workforce readiness through higher education, where it ranks 42nd in the nation, providing considerable room for improvement.
Notes
- “Midwest Economy Index,” Federal Reserve Bank of Chicago, October 31, 2017, www.chicagofed.org/publications/mei/index.
- C. Farand, “Donald Trump Disassembles 90 Federal State Regulations in Just over a Month in White House,” The Independent, March 6, 2017, www.independent.co.uk/news/world/americas/donald-trump-federal-state-regulations-month-oval-office-white-house-us-president-deregulate-a7614031.html.
- Methods and definitions regarding GDP are according to the U.S. Bureau of Economic Analysis (2017). The expenditures approach is the sum of all expenses including personal consumption, capital investment, government spending and net exports. In the income approach, GSP is estimated by summing incomes earned and production costs.
- Based on U.S. Bureau of Economic Analysis data from www.bea.gov/iTable/index_regional.cfm.
- Based on U.S. Bureau of Economic Analysis data from www.bea.gov/iTable/index_nipa.cfm.
- See note 5.
- U.S. Bureau of Economic Analysis 2015 detailed breakouts were taken on October 22, 2017 from www.bea.gov/itable/iTable.cfm?ReqID=70&step=1#reqid=70&step=7&isuri=1&7003=900&7004=naics&7005=-1&7006=18000&7001=1900&7002=1&7090=70&7093=levels.
- Forecasts from the Indiana University Center for Econometric Model Research at the Indiana Business Research Center: https://ibrc.kelley.iu.edu/analysis/cemr/index.html.
- “Projected Light Vehicle Sales in the United States from 2016 to 2020,” Statista. Taken on October 23, 2017 from www.statista.com/statistics/605157/projected-car-sales-in-united-states/.
- “United States Total Vehicle Sales,” Trading Economics. Taken on October 23, 2017 from https://tradingeconomics.com/united-states/total-vehicle-sales.
- W. Witte, comments recorded at the Indiana Business Research Center meeting on October 18, 2017.
- See note 10.
- A. Roberts and J. Stoll, “U.S. Auto Sales Set Annual Record,” Wall Street Journal, January 4, 2017, www.wsj.com/articles/auto-industry-poised-to-set-annual-sales-record-1483541246.
- M. Wall, “Automotive Industry Outlook: Navigating the Waters in a Post-Recovery Environment,” IHS Markit, October 2016, www.spratings.com/documents/20184/908551/US_CO_Event_Auto2016_Article3.pdf.
- See note 5.
- Additionally, for instance, BeijingWest Industries announced in April 2017 that they will invest $80 million in a new facility in Greensburg, wherein they expect to hire over 400 workers. This production facility is scheduled to open in 2019.
- K. Oliver, “Healthy Future: Consumer Demand for Biologic Drugs Will Stimulate Industry Revenue Growth,” IBISWorld Industry Report 32541a – Brand Name Pharmaceutical Manufacturing in the US, 2017.
- C. Bauer, “Toyota-Mazda Plant Not Coming to New Carlisle or Any Other Indiana Site,” South Bend Tribune, October 24, 2017, www.southbendtribune.com/news/local/toyota-mazda-plant-not-coming-to-new-carlisle-or-any/article_fb202b43-4ba5-5cad-af54-4ae6ab7fd421.html.
- J. Korzenick, 2018 Economic Forecast. Fifth Third Bank. Presentation delivered on October 25, 2017.
- Annual numbers from 2010 through 2017 (estimated) from STATS Indiana and the U.S. Bureau of Labor Statistics.
- See note 19.


