Columbus forecast 2018

Associate Professor of Finance, Indiana University Division of Business, Indiana University–Purdue University Columbus
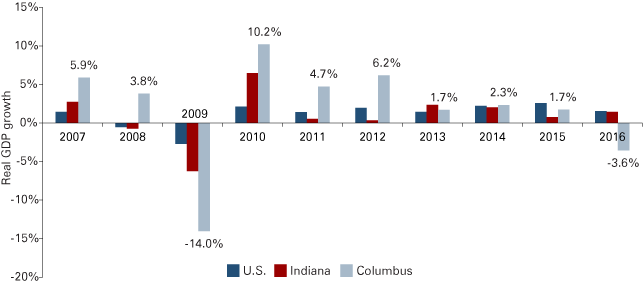
Columbus GDP fell in 2016 from 2015 levels by 3.6 percent, marking the first decline for the Columbus Metropolitan Statistical Area (MSA) since 2009, when the community sustained a 14 percent drop in total output. Indicators relevant to the local economy suggest GDP levels going forward for the coming months will likely be relatively flat—increasing by approximately 2 percent, as Columbus is poised to continue at or near full employment. The Columbus MSA (which consists of Bartholomew County) boasts the region’s lowest unemployment rate and the best average wage rate. Indeed, the pressure on increases in wages may fuel any slight GDP expansion for the area, mitigating the possibility of job losses that could materialize if the automotive industry would peak before 2018 is over. The 2 percent GDP increase forecast for Columbus includes a combination of population growth, jobs, technology-driven outputs and wage growth.
Key Measures
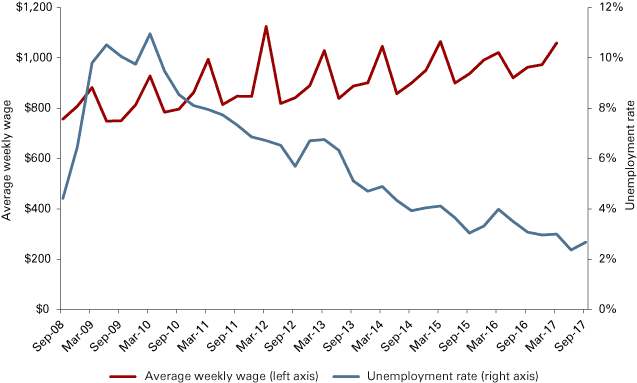
Unemployment: With a current unemployment rate of 2.7 percent, upward wage pressure is on employers who seek to expand business in Columbus. Businesses around the Columbus MSA are now struggling with a deficit of available employees during the holiday retail season, a time when employment opportunities for service jobs tend to peak.
Local area weekly wages have risen by more than 20 percent over the past seven years, from $800 in 2009 to nearly $1,000 in 2016. In the last three years of data, local wages have risen by 15.6 percent, or an annual rate of 5.0 percent—or 500 percent in excess of the consumer price index (CPI), which was measured at 1.0 percent per year over the same period (see Figure 1).1
Figure 1: Average weekly wages and the unemployment rate in the Columbus MSA
Source: U.S. Bureau of Labor Statistics
Unemployment rates across America and throughout Indiana have continued to trend lower over the past year, with the U.S. rate as of September at 4.1 percent and Indiana at 3.6 percent (the latter now considered to be at “full employment”). The rate for Columbus is an impressive 25 percent lower at 2.7 percent, reflecting conditions that would make any mayor very proud, while simultaneously frustrating area human resources managers. Without population growth able to keep pace with job demands and with labor force participation throughout the region at levels not seen since before the Great Recession, it would now appear that the conditions are set for wage increases over the coming year. See Table 1 for unemployment rates among selected Indiana metros and micros.
Table 1: September unemployment rate comparison for selected Indiana metros and micros
| 2013 | 2014 | 2015 | 2016 | 2017 | |
|---|---|---|---|---|---|
| U.S. | 7.0% | 5.7% | 4.9% | 4.8% | 4.1% |
| Indiana | 6.8% | 5.3% | 4.1% | 4.0% | 3.6% |
| Bloomington | 6.3% | 5.3% | 4.2% | 4.1% | 3.5% |
| Columbus | 5.1% | 3.9% | 3.0% | 3.1% | 2.7% |
| Evansville | 6.2% | 4.8% | 3.6% | 3.8% | 3.2% |
| Greensburg | 7.6% | 5.8% | 4.4% | 4.3% | 4.0% |
| Indianapolis-Carmel-Anderson | 6.6% | 5.2% | 3.9% | 3.7% | 3.4% |
| Kokomo | 7.1% | 5.6% | 4.3% | 4.0% | 3.6% |
| North Vernon | 7.8% | 5.7% | 4.1% | 4.2% | 3.6% |
| Seymour | 5.7% | 4.5% | 3.5% | 3.4% | 3.0% |
Note: Data are not seasonally adjusted.
Sources: U.S. Bureau of Labor Statistics and Indiana Department of Workforce Development
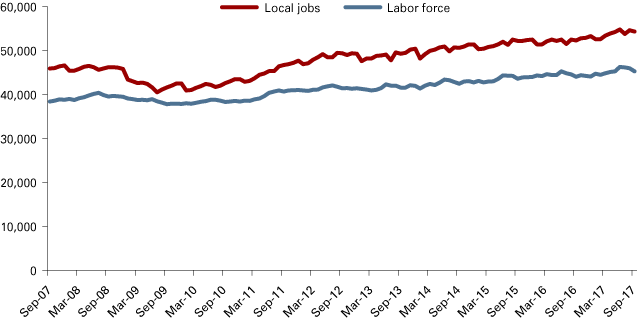
Employment and labor force: Columbus has been creating job growth over the past eight years with remarkable efficiency. During this period, Columbus has produced about 13,100 jobs. As of September 2017, Columbus area employers provided 54,300 jobs to a local labor force of 45,274 (see Figure 2).2 These numbers are up from 53,200 and 45,114, one year ago, respectively. For the past five years, Columbus employers consistently have provided a net 8,000-10,000 jobs to citizens outside of the Columbus MSA. As of September 2017, the net labor import number is 9,026 in Columbus. Job growth over the prior 12 months was 1,100, or 2.1 percent, while labor force growth over the prior 12 months was only 160, or 0.4 percent. This slowing growth in labor force participation combined with an ultra-low 2.7 percent unemployment rate implies that future job growth in Columbus without further population growth will be a challenge.
Figure 2: Local jobs and local labor force
Source: U.S. Bureau of Labor Statistics and Indiana Department of Workforce Development
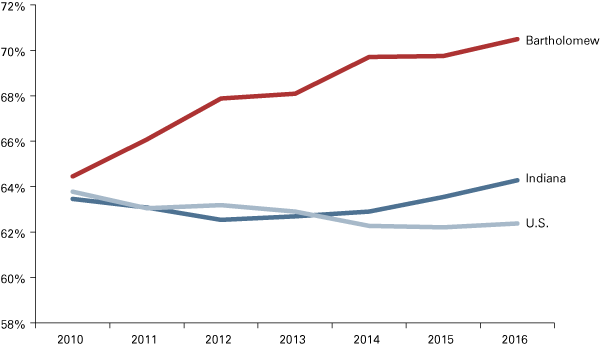
The labor force participation rate (LFPR) in Columbus has been tremendous and improving. For instance, in 2012, the Columbus LFPR was 68 percent, while Indiana was 62.5 percent and the U.S. LFPR was 63.2 percent. Then, in 2014, the Columbus rate grew to 69.7 percent, while the Indiana LFPR grew to 62.9 percent and the U.S. rate dropped to 62.3 percent. The most recent population and thus LFPR numbers are from June/July 2016. In that reading, Columbus was at 70.5 percent, Indiana’s LFPR had grown to 64.3 percent and the U.S. LFPR measured at 62.4 percent (see Figure 3).
Figure 3: Labor force participation rate
Source: U.S. Census Bureau and Bureau of Labor Statistics
Job growth, wage growth, a skilled workforce, an impressively highly productive population and high-tech GDP growth earned Columbus, Indiana, national recognition as the second-best small city overall in America in 2014 for attracting additional capital investment.3 Area Development magazine has included Columbus as one of its “leading locations” for new and expanding businesses each year from 2012 to its most recent publication in 2017.4
Investments continue to drive into Columbus in 2017, with consistent investment flowing into the community over the past several years. Between 2008 and 2016, businesses invested over $550 million in the Columbus MSA. The Columbus Economic Development Board reports that more than $100 million in additional capital investments have been announced in Columbus in 2017 and for 2018 (see Table 2).5, 6
Table 2: Columbus MSA planned business investment announcements since the Great Recession
| Year | Number of expansions | Investment ($ millions) | Number of employees |
|---|---|---|---|
| 2008 | 3 | 16.05 | 511 |
| 2009 | 0 | 0.00 | 0 |
| 2010 | 11 | 23.68 | 515 |
| 2011 | 9 | 35.52 | 945 |
| 2012 | 15 | 67.41 | 249 |
| 2013 | 18 | 135.98 | 884 |
| 2014 | 11 | 52.64 | 130 |
| 2015 | 9 | 156.15 | 181 |
| 2016 | 7 | 70.79 | 37 |
| 2017* | 2 | 23.50 | 63 |
| 2018* | 3 | 80.00 | TBD |
* Announced
Source: Columbus Economic Development Board
As an example of what is known as “the Columbus way” (disparate groups coming together to provide solutions to challenging community problems), the State of Indiana, the City of Columbus, Louisville & Indianapolis Railroad, CSX and Cummins, Inc. have come together to develop a plan for a $30 million railroad overpass along the western entrance into the downtown area, at State Road 46 and State Road 11, saving considerable time for the 40,000 vehicles per day traveling through that intersection.7
Leading indicators
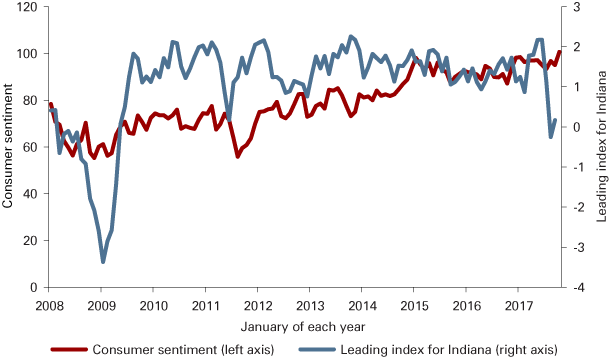
State leading index and consumer sentiment: These numbers relate to Indiana and the United States, respectively, yet they also impact Columbus—particularly since Columbus is dependent on capital investment (manufacturing) and consumer spending (transportation). Since 2009, both of these measures had been generally increasing through June 2016.
However, from July-August 2017, the leading index for Indiana dropped to -0.25, its lowest number since 2011, which could indicate concern statewide.8 But the drop is likely the result of Hurricane Harvey, which may have been expected to initially chill demand for durable goods made in Indiana. The number rebounded to 0.17 in September, and the end result of the hurricane was additional demand on durable goods because 500,000 light vehicles were destroyed in Texas, shifting demand curves temporarily in Indiana to the right.9 It is believed the state leading index will continue to show signs of general health in 2018.
Consumer sentiment remained high with readings over 100.7 at the October survey, the highest reading since before the Great Recession (see Figure 4).10
Figure 4: Leading index for Indiana and consumer sentiment index
Source: Philadelphia Federal Reserve Bank and the University of Michigan
Purchasing Manager’s Index (PMI): In October 2017, the PMI measure came in at 58.7, well above 50, and is a good indication that manufacturing remains healthy from the perceptive of purchasing managers. This suggests that the manufacturing economy will continue to be strong in manufacturing-heavy states like Indiana and manufacturing-heavy towns like Columbus (see Table 3).
Table 3: Purchasing Manager’s Index
| Month | PMI |
|---|---|
| November 2016 | 53.5 |
| December 2016 | 54.5 |
| January 2017 | 56.0 |
| February 2017 | 57.7 |
| March 2017 | 57.2 |
| April 2017 | 54.8 |
| May 2017 | 54.9 |
| June 2017 | 57.8 |
| July 2017 | 56.3 |
| August 2017 | 58.8 |
| September 2017 | 60.8 |
| October 2017 | 58.7 |
Note: Values above 50 generally indicate that the manufacturing economy is expanding, while values below 50 indicate contraction.
Source: Institute for Supply Management
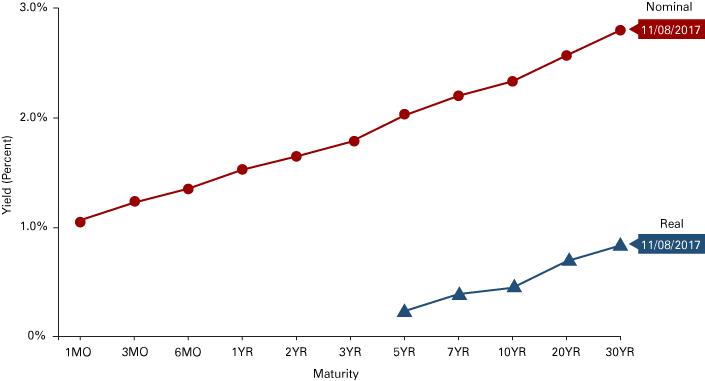
Yield curve: The yield curve for U.S. treasuries remains in normal form, although it has flattened over the past year (see Figure 5). Last year (Nov. 4, 2016) the 10-year/2-year spread ratio was 2.25, while this year (Nov. 8, 2017) it measured 1.44, which is 36 percent flatter now than it was last year at this time. Short-term rates are now at or above 100 basis points, while 30-year securities were measured at 2.8 percent as of Nov. 8, 2017.11 Inflationary threats from wage increases are now considered, as the Federal Reserve board continues to plan to increase short-term rates, although the incoming Federal Reserve chair is unproven.
Figure 5: U.S. Department of the Treasury yield curve
Source: U.S. Department of the Treasury
Local building permits: From October 2008 through September 2009, 121 residential building permits were filed in Bartholomew County.12 Each following year saw increases in the number of residential building permit filings through 2015. However, in 2016 and again in 2017, Columbus has seen a decline in permits by 23.0 percent followed by 4.4 percent. Measured by fiscal years (October through September), building permit applications have begun to show weakness (see Figure 6).
Figure 6: Local building permit trends for the Columbus MSA
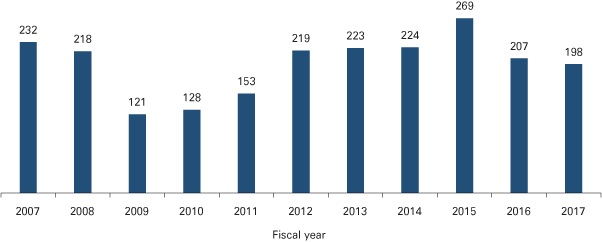
Note: Data for each fiscal year reflect October to September data.
Source: U.S. Census Bureau
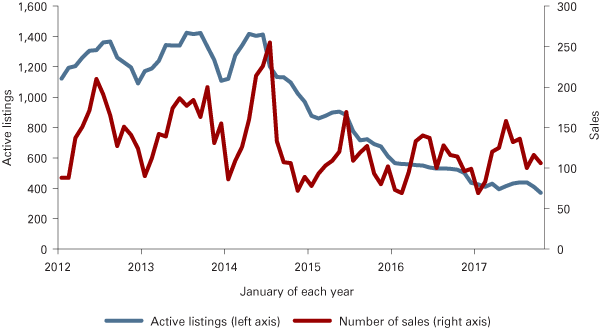
Residential housing sales: With new building permit numbers declining, the residential real estate market has experienced a reduction of inventory and lower sales turnover. While 2017 may have seen fewer listings, this market has been slowing down over the past three years. In August 2016, 128 homes sold, yet in August 2017, only 100 homes sold. This market’s most recent peak occurred in 2014, wherein 255 homes sold that July (see Figure 7).
Figure 7: Columbus residential real estate sales turnover and inventories
Source: Metropolitan Indianapolis Board of Realtors
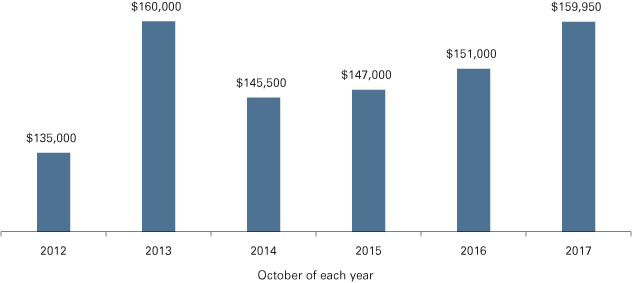
With reduced inventories—from 723 in September 2015 down to 370 as of September 2017 (a total reduction of 48.8 percent, or a 22.0 percent compound annual average inventory drop)—home prices have risen by 8.8 percent (4.3 percent compound annual price growth) in spite of a one-year drop of 21.8 percent in total transactions activity (see Figure 8).
Figure 8: Residential real estate median sales price trends in Columbus, Indiana
Source: Metropolitan Indianapolis Board of Realtors
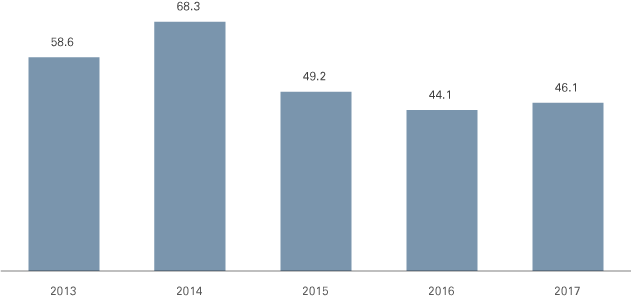
Figure 9 shows that during the residential real estate activity slowdown over the last three years, time to sell homes has stabilized. In sum, with interest rates on the rise, fewer people are entering the market to sell having already locked in historically low interest rates. Meanwhile, demand for housing in Columbus has remained reasonably strong with continued modest job growth in spite of the tightest labor market around, leading to solid price appreciation and reduced inventories.
Figure 9: Median days to sell in Columbus MSA residential real estate market
Source: Metropolitan Indianapolis Board of Realtors
Local real GDP growth: Chained GDP has risen in the Columbus MSA year over year from $3.9 billion in 2009 to the 2015 output peak of $5.1 billion.13 However, real GDP growth rate in Columbus turned negative in 2016, falling to $4.9 billion, a drop of 3.6 percent (see Figure 10).14 That puts 2016 GDP on par with 2014 levels in Columbus.
Figure 10: Year-over-year GDP growth
Source: U.S. Bureau of Economic Analysis
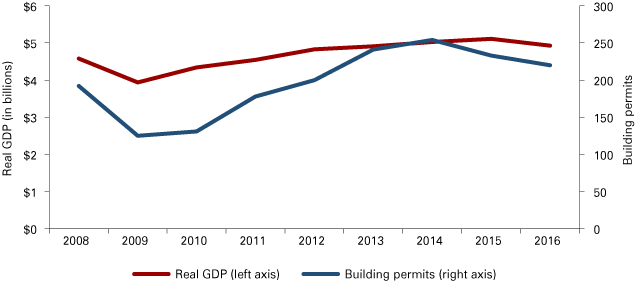
In the early part of the recovery, Columbus expanded rapidly, outpacing the state and the country. Building permits dropped in 2015 from 2014 levels, and then GDP in Columbus dropped in 2016 from 2015 levels, the first time since the recession. This pattern happened back in 2007-2008, leading into the recession. And again, we have noticed another (likely) decline in building permits filed in 2016 (220) versus the prior year (233). As for 2017, a trailing 12-months number suggests building permits are down again in 2017.15 This downward trend suggests headwinds for additional GDP growth in the Columbus area, particularly given the connection between building permits and a one-year lag in GDP growth (see Figure 11).
Figure 11: Real GDP and building permits in Columbus MSA
Sources: U.S. Bureau of Economic Analysis (chained GDP) and U.S. Census Bureau (building permits)
Columbus Area Stock Index (CASI): The composition of the Columbus economy may be reflected by an index of publicly traded securities relevant to the community. CASI was developed as a tool to keep abreast of the returns performance of securities affecting the local community and as a tool useful for forecasting local economic conditions.16
CASI is an economy-size-weighted index, which weights each component by the number of total jobs estimated to be produced and available in the Columbus MSA. Therefore, securities were selected using area employment as the basis for inclusion in the index. Not all sectors in the local economy were considered. Where the economic condition of a sector was estimated to change relative to some other independent sector, then the dependent sector was excluded.
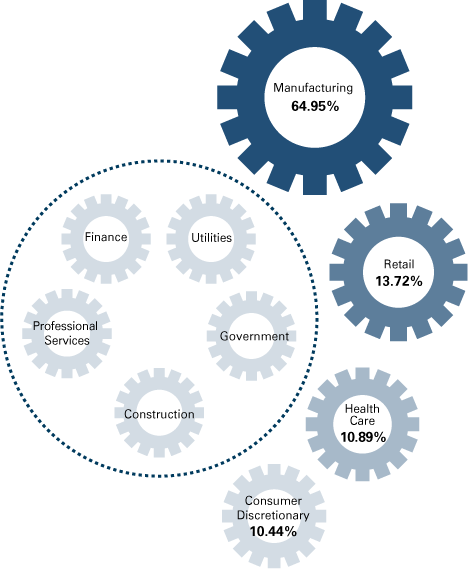
Figure 12 shows a graphic of the major Columbus area employment sectors, how they are interrelated, and to what extent each plays a role in the health and vitality of the local economy by providing jobs. Weights reflect the percentage of the core or base employment jobs available within the Columbus MSA. Support jobs are not included in this analysis. Thus, for instance, of the base jobs in the Columbus MSA, nearly two-thirds of them are in manufacturing.
Figure 12: CASI sectors included for the Columbus core economy
Source: Indiana University–Purdue University Columbus
In its current form, CASI reflects the aggregate economy of Columbus, Indiana. Manufacturing, retail (e.g., grocery and staples), consumer discretionary (e.g., restaurants, hotels, hospitality and tourism), and health care are the core, independent sectors in the Columbus economy. Finance, utilities, government, professional services and construction—were estimated to rise and fall according to the performance of the four independent sectors. Securities were then selected to represent active participation in the local economy. These securities were then weighted according to the estimated number of jobs filled by each organization or group (see Table 4).17
Table 4: Components of Columbus Area Stock Index
| Independent sector (sector weight) | Proxy | Percentage | Weighting | Scaled weights |
|---|---|---|---|---|
| Health care (10.89%) | Vanguard ETF (healthcare) | 10.89% | 4.76 | 10.89 |
| Consumer discretionary (10.44%) | Vanguard ETF (consumer discretion) | 10.44% | 4.57 | 10.44 |
| Manufacturing (64.95%) | Cummins | 39.76% | 17.39 | 39.76 |
| Faurecia (private auto supply) | 8.02% | 3.51 | 8.02 | |
| Honda | 5.83% | 2.55 | 5.83 | |
| Ford (proxy for other auto suppliers) | 5.83% | 2.55 | 5.83 | |
| Toyota | 5.51% | 2.41 | 5.51 | |
| Retail (13.72%) | Simon Property Group | 3.43% | 1.50 | 3.43 |
| Wal-Mart | 5.72% | 2.50 | 5.72 | |
| Target | 2.29% | 1.00 | 2.29 | |
| Lowe’s | 2.29% | 1.00 | 2.29 |
Source: Indiana University–Purdue University Columbus
Where no individual security could be found, such as is the case for health care and consumer discretionary sectors, Vanguard ETFs were selected to approximate local employer return performance. The index was then created looking at daily adjusted close prices from 2004 through Nov. 8, 2017, and compared to the S&P 500 (daily adjusted close prices), which is a market capitalization value-weighted index.18 The S&P 500 daily adjusted close hit its low point on March 9, 2009. ^GSPC is an ETF reflecting the S&P 500, and its value on that date was 676.53. On that same date, the CASI was measured at 82.24, whereas the 10-year low for CASI was measured at 78.72 on Nov. 20, 2008.
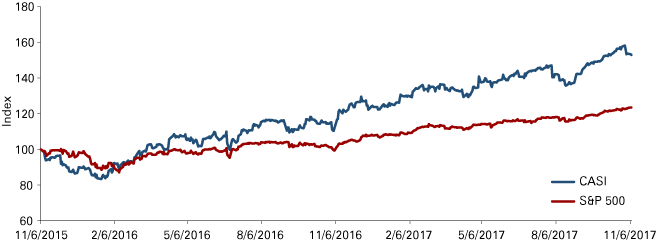
CASI was up by 22 percent from Jan. 4 through Nov. 7, 2017, while the greater S&P 500 was up about 14 percent over the same period (see Figure 13). The positive stock market trajectory indicates bright possibilities for the year ahead for the Colmbus area firms competing in a global marketplace. This is consistent with the recent Cummins third-quarter earnings report, as well as the updated automotive industry expectations for 2018, indicating continued strength for now.
Figure 13: CASI and S&P 500 performance comparison
Source: Author’s calculations and Yahoo Finance
National and global considerations
National issues: The flattening yield curve and continued budget deficits bring risks to the downside, while political discord continues as well. Upside potential includes the tax reform push, which could add some fuel to GDP growth if a bill is signed into law. Additional downside risk includes the increasingly tight labor market in many employment markets across the country, including Columbus. The national policy on immigration may impact growth potential.
Global issues: China continues to experience growth surpassing prior expectations, with reports of growth possibly reaching 7 percent again for 2017 and 2018.19 The overall U.S. unemployment rate is now 4.5 percent, the lowest in nine years. Continued implications for cheap commodities and oil may not be well understood, yet certainly many sectors have been harmed (including energy and mining) worldwide, even as oil shows promise for a pricing recovery in 2017. These two sectors in particular have proven material in decelerating sales growth for Cummins in their high horsepower engine and power generation segments (largely overseas) through October 2016. Cummins has largely positioned itself for continued flat sales through 2017.
Outlook
Last year, the Columbus MSA economic outlook for 2017 was neutral to slightly negative. The results were mixed, with the most recent GDP estimates confirming a slight downtick (-3.6 percent) in output, but a simultaneously increasing number of area jobs (up 2.1 percent).
For 2018, continued growth is slightly overshadowed by suspicions that the economic expansion seen in Columbus over the last eight years may be facing headwinds generally arising from a tremendously tight local labor market. GDP growth will likely be fueled by Cummins’ expected strong performance next year, as well as sustained automotive demand encouraged by Hurricane Harvey heading into 2018.
Upside potential
Leading general indicators
- PMI remains well above 50, which implies continued manufacturing expansion.
- Cummins stock (CMI) has increased in value by over 23 percent since the beginning of 2017.
- The yield curve remains in normal form, although 36 percent flatter than last year.
- Consumer sentiment (and spending) continues to buttress the economy with strength.
- CASI has performed very strong this past year compared to the S&P 500, which was also strong.
Local indicators
Additional planned investment: Locally, five projects have been announced for business and infrastructure improvements amounting to over $100 million, and some have stated plans for continued future hiring in the area with plans for about 63 new positions having been announced to the Columbus Economic Development Board.
Cummins: 2017 numbers to date have included sales increases in each of Cummins’ business units. Power systems are up 23.4 percent in Q3 (year-over-year) as international markets have strengthened. Engines are up 25.7 percent in Q3, arising from the natural industry cycle of medium and heavy truck sales in North America rising out of its low points in 2016. Components are up 34.1 percent in Q3, boosted by strength in North American markets. The distribution segment is up 16.6 percent in Q3 due to strong and consistent organic growth, as well as continued acquisitions and thoughtful asset divestiture. Class 8 heavy duty engines commonly seen in long-haul semi-trucks are expected to experience improved sales through 2018.20
Financial conditions for Cummins show strength: Total liabilities / equity (TL/E) is 1.1, while interest-bearing debt / equity (IDB/E) is 0.16. Cummins' current ratio (CR) is 1.57, and 2017 total sales are expected to be 14-15 percent higher than in 2016. Earnings before interest and taxes (EBIT) are forecasted to be around 12 percent of sales, while that number was 11.4 percent last year. Third-quarter earnings were $453 million, compared to $289 million the same period in 2016—up 56.7 percent.21 With a stock price above $170 per share—at or near an all-time high—Cummins, Inc. is firing on all cylinders.
It is expected that Cummins will continue to strategically hire professionals in the Columbus area to further develop clean diesel technologies, as well as projects in electrification and other power systems. Finally, Cummins plans to invest in its Columbus downtown corporate office complex ($50 million), and they are a willing partner in enhancing the western entrance into downtown Columbus with participation in a $30 million railroad overpass, scheduled for construction in 2018-2019.
Downside potential
Leading general indicators
- The state leading index for Indiana fell in August, perhaps due to hurricane activity.
- The number of local building permits have fallen for two consecutive years.
- GDP locally fell 3.6 percent in 2016—the first decline in output since the recession.
Local indicators
Automotive industry: The annualized sales rate as of October 2016 was 17.66 million units. The 2017 numbers have been in the 16 million to 17 million range, down from last year. While the projection to bump sales levels from hurricane replacement needs could be good news for Columbus in the very short term (two-four months), the expected industry decline in 2018 may hinder capital investment or sustainable job growth in Columbus in future periods.
Employment base: Columbus boasts the lowest unemployment rate in the region at 2.7 percent. Also, wages have begun to increase in the area. Further, with a labor force participation rate of over 70 percent, workers are increasingly hard to find. Columbus has one of the tightest labor markets in the state, which could present a difficulty for GDP growth if there is not new population growth to accommodate unfilled jobs.
Opioids: The opioid/opiate epidemic has affected communities in Indiana (and beyond) in ways that are now measurable in terms of direct GDP loss. With incredibly tight labor markets, all prospective employees lost from the workforce result in lost GDP production at the margins. In Columbus, it has been estimated that 780 to 1,000 citizens misuse opiates, out of an affected population of 81,402 (2016 Census estimate), for a misuse rate between 0.95 percent and 1.22 percent.22 This results in lost potential output.
To calculate the direct effects, initially, the participants in the labor force were considered. Opioid users were categorized into educational levels, which correspond to median weekly earnings.23 Using a population ratio between the U.S. and that of the Columbus MSA, the estimated numbers of opioid users in Columbus at each earnings level were then calculated. Earnings were summed. This number includes the total opportunity set of median annualized earnings by all opioid misusers in Columbus. To adjust for employment, the national unemployment rate for opioid misusers was compared to the general unemployment rate during the same period.24 The unemployment rate for opioid users was 17.1 percent in 2016, while the unemployment rate in general in 2016 was 4.4 percent.25 Thus, opiate misusers were unemployed at a rate 389 percent higher than the general population. Moreover, while the rate of opiate use has reportedly increased in 2017 and the Columbus unemployment rate has decreased to 2.7 percent, this “opioid unemployment ratio” could be reasonably estimated at 500 percent, reflecting a higher impact in a tighter labor market.
To account for the lost earnings, the general unemployment rate was subtracted from the opiate unemployment rate, and the corresponding difference was multiplied by the total opiate-affected wages. Finally, the lost output was estimated by application of a ratio, covering seven years through the recovery (2010-2016), which converted the product of total Indiana state quarterly wages and total Indiana jobs at each point, into Columbus GSP output.26 That ratio—specific to the Columbus MSA—over the years 2010-2016 was 2.28.
Estimates for total opiate-misusers in Columbus range from 780 to 1,000.27 Thus, the total opiate-affected wages across educational strata in Columbus is estimated to range from $32.3 million to $41.4 million. Applying the GSP multiplier of 2.28, the direct output loss is estimated to range between $9.36 million and $15.59 million.
- Low-range direct opioid Columbus GSP loss = $32.3M x (0.1712 – 0.0440) x 2.28 = $9.36 million
- High-range direct opioid Columbus GSP loss = $41.4M x (0.1712 – 0.0270) x 2.612 = $15.59 million
The effective reduction in available labor force is a second component of estimating the loss to the Columbus economy from opioid misuse. CNN reported that among 1.8 million workers out of the labor force nationally for “other” reasons, approximately 48.9 percent of them surveyed having used opiates the day before.28 This yields an opiate-affected group of 881,000 across America who are out of the labor force, hypothetically due to opioid misuse. When factoring in the Columbus MSA population (81,400) and the U.S. population (326,200,000), it is estimated that 220 Columbus workers are out of the labor force (thus, not counted as “unemployed”) specifically because they are part of the opioid epidemic.29 Taken that about 25 percent of these cases are misusers and unable to contribute gainfully to the economy because of opioid misuse, we reduce this number of Columbus residents to 55.30 Multiplying this raw number by the average annual wages in Columbus of $50,440 (as of 2016), we arrive at $2,774,200. Multiplying by 2.28 gets us to an estimate of economic output, which in this case is about $6.33 million.
Therefore, the combined estimate of lost output in Columbus currently is approximately $15 million to $20 million annually (direct losses plus indirect losses), and this number is likely on the rise. With Columbus having a total economic output of $5 billion, the opioid epidemic reduces output by approximately 0.35 percent. This loss accounts for 9.7 percent of the decline in GDP in the Columbus MSA in 2016. For comparison, the statewide opioid loss to GDP is about $1.5 billion, or 0.44 percent.
Forecast: Columbus is most likely to experience net flat job growth in 2018, with a likely slight uptick in gross economic output. Columbus has built and continues to maintain its reputation as a great place for capital investment with the tremendous work ethic among its people and differentiated arts and architecture. Cummins is poised for solid growth and is making plans for further investment, though slow automotive sector growth may hamper opportunities for significant expansion.
Increases in wages may lure additional workers back into the workforce, yet with a labor participation rate of over 70 percent locally—how many more workers can we find? Eventually, inflationary effects, which may inspire the Fed to raise rates more quickly than in times past, disenchanting consumers, could ultimately signal the end of the business cycle. Since Columbus still depends disproportionately on cyclical business patterns to fuel its GDP, the coming three years may be challenging as we seek creative way to foster population and business growth.
Notes
- Federal Reserve Bank of Minneapolis, “Consumer Price Index, 1913- (Base year is chained),” https://www.minneapolisfed.org/about-us/monetary-policy/inflation-calculator/consumer-price-index-1913-
- U.S. Bureau of Labor Statistics data from www.stats.indiana.edu/laus/laus_view3.html.
- Milken Institute, “2014 Best-Performing Cities: Where America’s Jobs Are Created and Sustained,” January 2015, 33, https://milkeninstitute.org/report/best-performing-cities-2014
- Greater Columbus Indiana Economic Development Corporation, “Columbus, Indiana Once Again a Leading Location,” July 24, 2017, www.columbusin.org/columbus-once-again-a-leading-location-2/.
- Greater Columbus Indiana Economic Development Corporation, “Cummins, State of Indiana and City of Columbus Announce Two Investment and Improvement Projects Totaling $80 Million,” July 5, 2017, www.columbusin.org/cummins-state-of-indiana-city-of-columbus-announce-two-investment-and-improvement-projects-totaling-80-million/.
- Greater Columbus Indiana Economic Development Corporation, “Lindal Announces $20 Million Manufacturing Plant for Columbus,” March 9, 2017, www.columbusin.org/lindal-announces-20-million-manufacturing-plant-for-columbus/.
- See note 5.
- State leading index data taken from the Federal Reserve Bank of Philadelphia website: www.philadelphiafed.org/research-and-data/regional-economy/indexes/leading/.
- W. Witte, Meeting on October 18, 2017 at the Indiana Business Research Center of the Kelley School of Business, Indiana University.
- Consumer sentiment data taken from the University of Michigan website: www.sca.isr.umich.edu/.
- U.S. Department of the Treasury data from www.treasury.gov/resource-center/data-chart-center/Pages/index.aspx.
- U.S. Census Bureau data from https://www.census.gov/construction/bps/.
- U.S. Bureau of Economic Analysis data
- U.S. Bureau of Economic Analysis data
- These numbers come from manual sums using the Census Bureau’s monthly data bank for the Columbus MSA. However, it is noted that the Census Bureau also has listed the annual 2016 building permits number for Columbus to be 300. I believe this is incorrect, likely the result of a data entry error. The sum of the calendar year for Columbus is 220 when calculated manually using the monthly Census Bureau data source.
- R. Brewer, “Columbus Forecast 2015,” Indiana Business Review, Winter 2014, www.ibrc.indiana.edu/ibr/2014/outlook/columbus.html. The original idea for the CASI can be attributed to Michael Oakes, formerly a Lecturer of Finance at Indiana University–Purdue University Columbus. Special recognition goes to Kayla Freeman, who has collected data for this project over several years.
- Employment information for local employers was retrieved from Hoosiers by the Numbers on October 31, 2016 from http://www.hoosierdata.in.gov/highlights/profile.asp?geo_val=S18;C005&page_id=6. This weighting was not changed for the 2018 outlook.
- Daily adjusted close prices were retrieved from www.yahoo.com/finance. Adjustments include stock splits and dividends over the period.
- “World Bank Raises 2017, 2018 East Asia Forecasts, Sees Geopolitical Risks,” CNBC, October 4, 2017, www.cnbc.com/2017/10/04/world-bank-raises-2017-2018-east-asia-growth-forecasts-sees-geopolitical-risks.html.
- A. Marsh, “Class 8 Market Dip in ’17, with Upbeat Outlook Farther Out,” FleetOwner, December 5, 2016, www.fleetowner.com/truck-stats/class-8-market-dip-17-upbeat-outlook-farther-out.
- Cummins, Inc., “Cummins Reports Third Quarter 2017 Results,” October 31, 2017, https://www.cummins.com/news/releases/2017/10/31/cummins-reports-third-quarter-2017-results.
- M. Webber, "Forging Ahead: Panel Discusses Next Steps to Battle Opioid Epidemic," The Republic, October 6, 2017, print edition.
- U.S. Bureau of Labor Statistics data from www.bls.gov/webapps/legacy/cpswktab5.htm.
- Substance Abuse and Mental Health Services Administration (SAMHSA), “National Surveys on Drug Use and Health 2016.” Taken on October 31, 2017 from www.samhsa.gov/data/sites/default/files/NSDUH-DetTabs-2016/NSDUH-DetTabs-2016.htm#lotsect1pe.
- See note 24.
- U.S. Bureau of Labor Statistics, Quarterly Census of Employment and Wages data from STATS Indiana at www.stats.indiana.edu/cew/.
- Author's calculation. Applies educational strata and corresponding weekly wages with information about opioid misusers by age group and demographic characteristics tabulated by the Department of Health and Human Services (Table 1.66A). Also considers a report published in the October 26, 2017 issue of the Republic, which suggests Bartholomew County is home to 1,000 opioid misusers. Demographic data on opiate misusers taken on October 31, 2017 from https://www.samhsa.gov/data/sites/default/files/NSDUH-DetTabs-2016/NSDUH-DetTabs-2016.htm#lotsect1pe.
- P. Gillespie, "The Opioid Crisis Is Draining America of Workers, CNN Money, July 27, 2017, https://www.ndwa.org/news/the-opioid-crisis-is-draining-america-of-workers/.
- This population likely constitutes a mix of opioid users who were already out of the labor force, as well as prior workers who left the labor force because of opioid abuse.
- The national addiction rate of opiate users is 20 percent. Twenty-five percent is applied here reflecting the additional likelihood that misuse is marginally more common among those who are not counted among the active labor force.


