Louisville Forecast 2016
Executive Vice Chancellor for Academic Affairs and Sanders Chair in Business, Indiana University Southeast, New Albany
As originally anticipated, 2014 turned out to be a good year for the Louisville metro. Year-over-year gains were among the highest since the recession, and total jobs added were the highest since the 1990s. By late 2015, however, payrolls had moderated from 2014. Weaker first quarter national growth and a softening manufacturing sector for the metro area both contributed to slower payroll growth for 2015. As we look to 2016, the Louisville metro will see moderate growth, but Southern Indiana will continue to experience quarters of impressive gains due to the River Ridge commercial area and the completion of the Ohio River Bridges Project.
Louisville Metro Payrolls
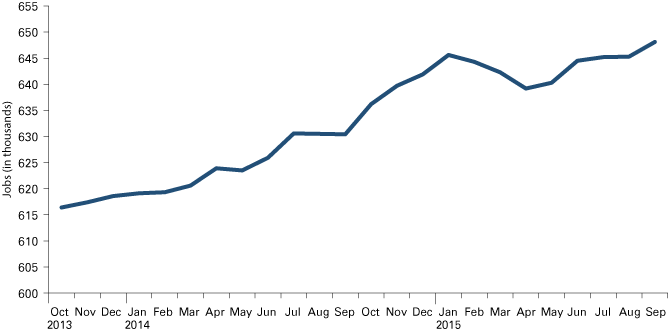
Louisville metro payrolls peaked in January and declined through much of 2015. The latest payroll numbers for the region now show metro payrolls finally surpassing the January total (see Figure 1). Even though the Louisville metro is more diversified today, overall job growth continues to be a function of the manufacturing economy. Current softening in manufacturing is partly responsible for the overall moderation in 2015.
Figure 1: Louisville Metro Nonfarm Payroll Jobs, October 2013 to September 2015
Source: Factset
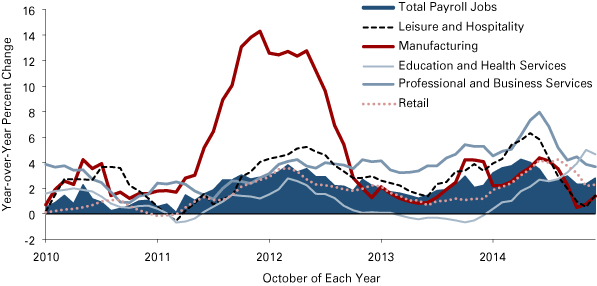
Current indicators continue to point to a softening manufacturing sector, and this will continue to provide headwinds for overall job growth. As Figure 2 shows, manufacturing growth is now less than overall job growth. Retail, leisure and hospitality, and professional and business services are also moderating in growth.
Figure 2: Year-over-Year Percent Change in Payroll Jobs for Selected Louisville Metro Sectors, October 2010 to September 2015
Source: Factset
2015 was a year of slower growth, certainly compared to 2014. Indicators also point to continued moderation in 2016. For example, one of the concerns is the downward trajectory in durable goods. Historical patterns indicate that a decline in national durable goods is typically associated with slower regional growth.
Southern Indiana Payrolls
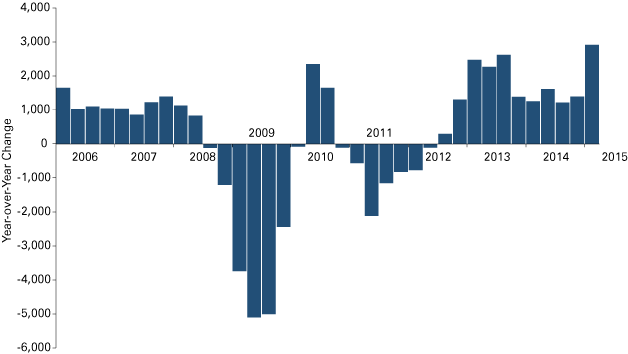
There is a different picture in Southern Indiana, although recent data also point to slower growth for the latter half of 2015. The most recently available county payroll data point to the strongest quarter for Southern Indiana since 2001. Given the size of the region today compared to prior years, the first quarter of 2015 could well be the best quarter ever for Southern Indiana (see Figure 3).
Figure 3: Change in Southern Indiana Payroll Jobs over Time
Source: STATS Indiana, using Quarterly Census of Employment and Wages data
Administrative and support services was the largest contributor to this impressive job growth, closely followed by manufacturing (see Figure 4).
Figure 4: Change in Southern Indiana Payroll Jobs for Selected Sectors
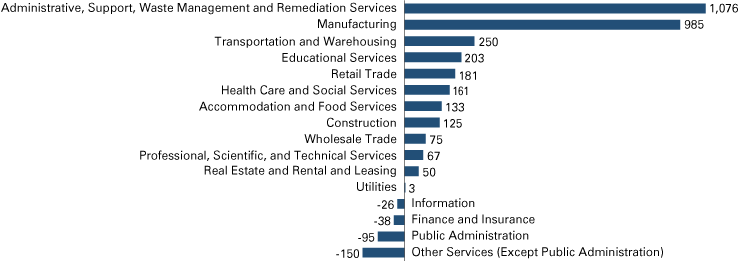
Note: This year-over-year change compares 2015 Q1 to 2014 Q1.
Source: STATS Indiana, using Quarterly Census of Employment and Wages data
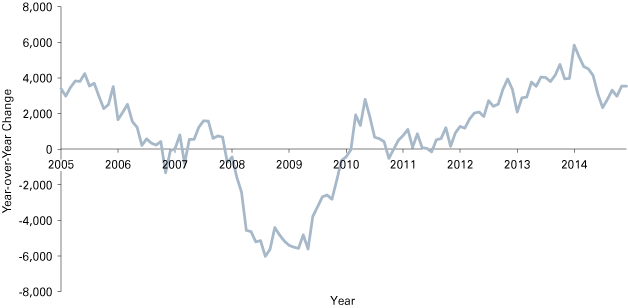
An examination of more current data for Southern Indiana indicates that payroll growth may not match the impressive first quarter (see Figure 5). Employment data show that the number of employed individuals decelerates from early in the year, and this could potentially translate to slower payroll growth for the second and third quarters of 2015. Despite this, the overall outlook for Southern Indiana, primarily due to River Ridge, is favorable.
Figure 5: Change in Southern Indiana Employment, October 2005 to September 2015
Source: Factset
Unemployment Rates
Unemployment rates in the region continue a steady decline, with unemployment rates now under 5 percent. While unemployment rates look attractive, the direction of the labor force and the number of employed brings potential concern. In the Louisville metro, for example, the size of the labor force is lower today than a year ago. The region’s number of unemployed is only slightly smaller. Hence, the region’s decline in the unemployment rate is likely a function of a smaller labor force, and not necessarily an increase in the number of employed. Weak growth in both employment and the labor force suggests that some employers will continue to struggle to find workers. Beyond that, the decline in the region’s unemployment rate is not as impressive when one dissects the determinants of that rate.
Building Permits
Building permits continue to increase, but have yet to match levels that existed prior to the Great Recession (see Figure 6). Clark County continues to account for a large majority of permits in the region, and this trend is expected to continue and even accelerate with the opening of the East End Bridge, and continued expansion of River Ridge. As development continues to increase on the Southern Indiana side, single-family permits will continue to expand as a percentage of overall building activity, and most of this growth will occur in Clark County.
Figure 6: Total Building Permits for Selected Southern Indiana Counties
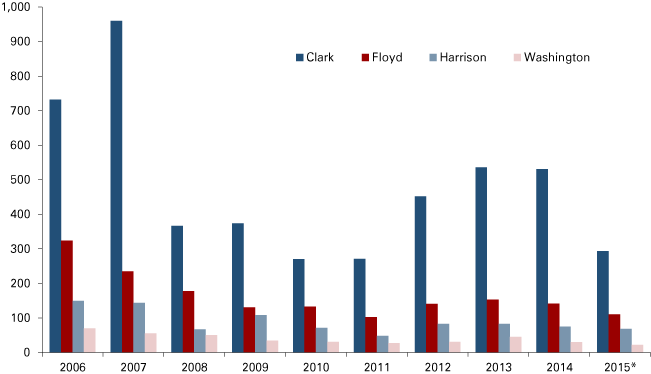
* 2015 data are August year to date.
Source: State of the Cities Data Systems
Outlook
The Louisville metro will continue to add jobs in 2016. Key national indicators do point to slower growth, and this will impact job growth in the region. Some of this slower growth is now evident in job changes for key sectors in Louisville. Manufacturing growth has slowed, as well as growth in professional and business services, retail, and leisure and hospitality. As River Ridge continues to see growth, and development from the bridges escalates, growth in Southern Indiana will provide a buffer for some of this slower growth in the Louisville region. Overall, 2016 will be one where we continue to see job gains, but at a slower pace than in recent years.


