Bloomington Forecast 2016
Director, Indiana Business Research Center, Indiana University Kelley School of Business
The Bloomington area economic performance in 2015 presented a mixed picture, with areas of both strength and weakness. The outlook for 2016 is generally encouraging, but with some challenges as well.
Local Economic Growth
At this time last year, the Bloomington metropolitan economy appeared to be on an upward trend, with manufacturing output leading the way. The latest advance estimates of the metro area’s total real gross domestic product (GDP), however, revise the story notably, indicating the local economy shrank in 2014 by 0.7 percent. Moreover, they show a steady decline of more than 6 percent in the area’s real GDP since it peaked in 2010 at $6.17 billion.1
Although advance GDP figures may be revised substantially as new data become available, the apparent shrinkage of Bloomington’s economy is not a welcome signal. Coupling this trend with continued population growth locally, Bloomington’s real GDP per capita has shrunk nearly 10 percent since peaking in 2009—in contrast to an average of 5.4 percent growth for all U.S. metro areas.
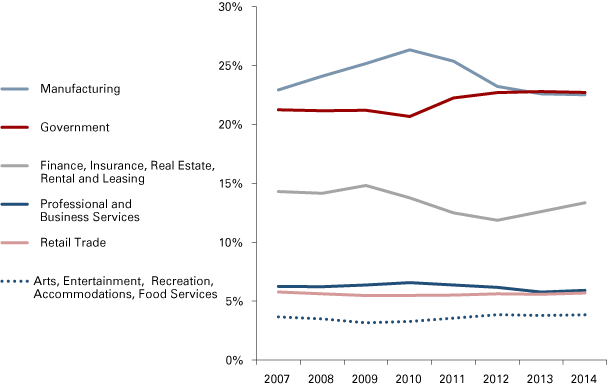
Last year’s U.S. Bureau of Economic Analysis (BEA) advance estimates showed Bloomington’s manufacturing output notably outperforming other sectors, growing steadily over several years to account for more than a quarter of the local economy. Revised data in this year’s GDP advance release tell a different story for those years, with manufacturing’s share of local GDP peaking at over 26 percent in 2010, but slipping steadily to 22.5 percent by 2014.
Figure 1 shows the output of the government sector slightly ahead of manufacturing, having gained two GDP share points since 2010 while manufacturing lost four. The next-largest sector includes finance, insurance, real estate, rental and leasing. That sector's percentage of the local economy rose modestly the past few years (though not in absolute dollar terms). Relatively stable sectors locally over the years include professional and business services, retail trade, and the arts and leisure industries.
Figure 1: Shares of Total Real GDP: Bloomington Metro

Source: U.S. Bureau of Economic Analysis
Among the smaller sectors, output from professional and business services was growing before and during the recession, but it has retreated slightly since 2010. Retail, in contrast, has doggedly maintained its share of the economic pie, as have the entertainment and hospitality industries. Local output of the construction sector, on the other hand, was 25 percent smaller in 2014 than in 2007 before the recession took hold.
Jobs and Wages Growing
2015 began with modest but encouraging growth in jobs and wages in the Bloomington metro area. Detailed first-quarter data (the latest available at this writing) reveal employment climbing by more than 800 workers (1.3 percent) since the first quarter of 2014, 25 more establishments, and wages growing by $17 million (2.6 percent, or $540 annually per job).
Sectors with relatively large employment shrinkage year-over-year include hospitals, administrative and support services, and utilities. Sectors showing notable growth include educational services; manufacturing; construction; insurance; restaurants and bars; and professional, scientific and technical services.2 All told, expanding establishments outnumbered shrinking ones nearly 2-to-1.
Monroe County’s unemployment rate has come down fairly steadily since peaking at 9.2 percent in 2010. The rate stood at 4.2 percent in September 2015, tying its lowest level since 2008 and below both the Indiana and U.S. rates. The local September rate represents 2,745 people looking for work, compared to more than 4,000 two years earlier.
Personal Income Rising Slowly
The latest real personal income (PI) data indicate Bloomington metro residents’ real personal income in 2013 rose by less than 1 percent to a record $5.37 billion. This modest improvement sustains a growth trend that has persisted throughout the recession and recovery.
Net earnings held steady at 63 percent of total PI, while the share generated by investment income remained at 19 percent (2 points lower than in 2007). Government retirement benefit payments remained at 16 percent of total PI, a couple of points above their share during the recession. Income maintenance and unemployment benefits accounted for only 2 percent of total PI in the Bloomington area, down slightly from 2012.
The metro area’s per capita personal income (PCPI) actually decreased 1.3 percent in 2013, in contrast to the prior year’s 1.6 percent increase. At the county level, Monroe County’s $32,892 PCPI ranked 83rd among Indiana counties, well below the state figure of $38,622. The relatively low per-capita values reflect the large number of students in the local population. Most student incomes tend to be low, so college towns typically occupy lower rungs of the PCPI ladder.3
An encouraging observation in the personal income data reveals that the Bloomington metro area average earnings-per-job has climbed nearly 17 percent since 2007.
Housing Market Strengthening
Monroe County year-to-date closed home sales through September 2015 were 15 percent above 2014’s pace, a solid growth rate. Median sale prices for the same period rose 4 percent, and the inventory of homes on the market in September was down 11 percent vs. a year earlier. The latter trend resulted in barely enough supply of homes to meet six months’ demand. This tightening of supply suggests a continued rise in home prices in the year ahead.
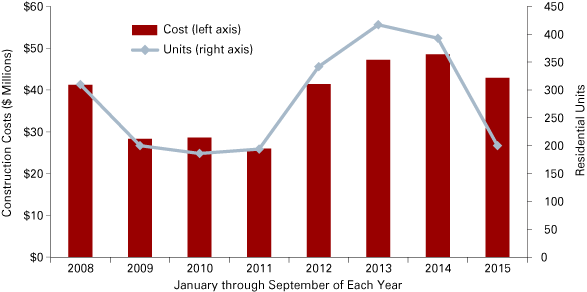
Local building permits in 2013 and 2014 for residential construction were at their highest levels since 2007, and 2015-to-date is not far behind. Figure 2, comparing January-to-September periods year over year, shows that though the number of housing units permitted so far in 2015 is well behind the last few years, the value of the construction remains relatively high. This suggests that upscale housing accounts for an increasing share of recent building activity.
Figure 2: Monroe County Residential Building Permits

Source: IBRC, using U.S. Census Bureau data
The Year Ahead
The IBRC’s Center for Econometric Model Research forecasts 2016 employment growth of about 2 percent for the Bloomington metro area, and personal income growth around 4 percent. These predictions rank Bloomington in the top handful of Indiana’s 14 metropolitan areas. This growth forecast reflects gradual improvement in the national and state economies, continued population growth, further momentum in construction and in professional and technical services, and a strengthening housing market.
Notes
- The U.S. Bureau of Economic Analysis issues GDP figures in multiple waves of revision. The advance statistics are the timeliest, but are based on data that are incomplete or subject to further revision by the source agency. Revised statistics based on more complete data will be released in 2016.
- Some of the growth may reflect the fact that first quarter 2014 was plagued by the so-called “Polar Vortex,” a long period of unusually wintry weather, whereas 2015 began comparatively mildly.
- IU fans may take some consolation in noting that Tippecanoe County ranked 87th (www.bea.gov/newsreleases/regional/lapi/2014/pdf/lapi1114.pdf).


