Anderson Forecast 2016
Dean, Falls School of Business, Anderson University
Overview
Historical, Long-Term Trends Are Reversing: Over the last few decades, Madison County and the greater Anderson community have experienced persistent unemployment, a long-term downward trend in employment and limited educational attainment. While significant challenges remain, the economic outlook for Madison County and the greater Anderson community has improved over the last few years.
Employment and Job Creation
Positive Unemployment Rate Trend: The unemployment rate for Madison County has fallen to less than half of what it was in 2010. As shown in Table 1, the unemployment rate declined from a high of 12.1 percent in 2010 to 6.0 percent as of September 2015.
Table 1: Annual Average Employment and Unemployment Rates
| Madison County | Indiana | |||
|---|---|---|---|---|
| Year | Employment | Unemployment Rate | Employment | Unemployment Rate |
| 2010 | 52,228 | 12.1% | 2,845,608 | 10.4% |
| 2011 | 52,415 | 10.9% | 2,892,327 | 9.1% |
| 2012 | 52,213 | 10.0% | 2,906,201 | 8.3% |
| 2013 | 52,708 | 9.3% | 2,947,114 | 7.7% |
| 2014 | 54,498 | 7.1% | 3,035,581 | 6.0% |
| 2015 | 55,710 | 6.0% | 3,088,307 | 5.1% |
Note: Data are not seasonally adjusted. 2015 data are from January to September.
Source: U.S. Bureau of Labor Statistics
Trends over the last 12 months are also improving. Table 2 shows that over the last year, the unemployment rate for Madison County decreased substantially by nearly 2 percentage points, from 6.5 percent in October 2014 to 4.6 percent in September 2015.
Table 2: Monthly Employment and Unemployment Rates
| Madison County | Indiana | |||
|---|---|---|---|---|
| Date | Employment | Unemployment Rate | Employment | Unemployment Rate |
| October 2014 | 55,287 | 6.5% | 3,082,775 | 5.6% |
| November 2014 | 55,273 | 6.8% | 3,072,231 | 5.9% |
| December 2014 | 54,896 | 6.8% | 3,053,447 | 5.7% |
| January 2015 | 54,453 | 8.1% | 3,035,573 | 6.7% |
| February 2015 | 54,087 | 7.5% | 3,022,613 | 6.1% |
| March 2015 | 54,458 | 7.0% | 3,027,410 | 5.9% |
| April 2015 | 55,107 | 5.4% | 3,064,602 | 4.6% |
| May 2015 | 56,088 | 5.6% | 3,105,292 | 4.8% |
| June 2015 | 56,680 | 5.3% | 3,135,481 | 4.8% |
| July 2015 | 57,182 | 5.3% | 3,149,567 | 4.8% |
| August 2015 | 56,877 | 5.0% | 3,127,568 | 4.4% |
| September 2015 | 56,462 | 4.6% | 3,126,659 | 4.0% |
Note: Data are not seasonally adjusted.
Source: U.S. Bureau of Labor Statistics
2014 and 2015 Mark Significant Job Increases: After long periods of stagnant and declining employment, the number of employed individuals in Madison County showed healthy increases for 2014 and 2015. As shown in Table 1, employment increased from 52,708 in 2013 to 54,498 in 2014, and then to 55,710 in 2015. These employment numbers represent an increase of 3.4 percent from 2013 to 2014 and an increase of 2.2 percent from 2014 to 2015.
Jobs Recovery Ahead of Indiana for 2015: The rate of growth in employment for Madison County surpassed Indiana over the course of the past year. As indicated in Table 2, Madison County employment increased from 55,287 in October 2014 to 56,462 in September 2015, compared to 3,082,775 to 3,126,659 for the state of Indiana. Madison County improved the number of jobs by 2.1 percent over the time period, while Indiana improved by 1.4 percent.
Closing the Gap
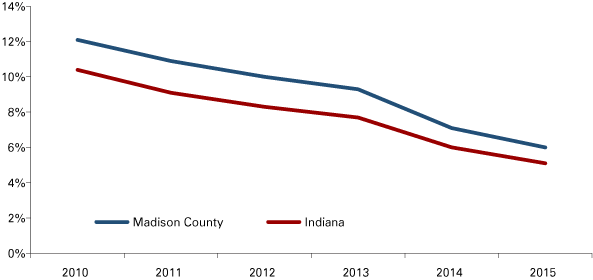
The unemployment rate for Madison County closely mirrors that for Indiana except Madison County trails Indiana by a significant gap. However, that gap has shown recent signs of closing. As illustrated in Figure 1, over the last several years, the unemployment rate gap between Madison County and Indiana has narrowed.
Figure 1: Comparing Indiana and Madison County Annual Unemployment Rates

Note: Data are not seasonally adjusted. 2015 data are from January to September
Source: U.S. Bureau of Labor Statistics
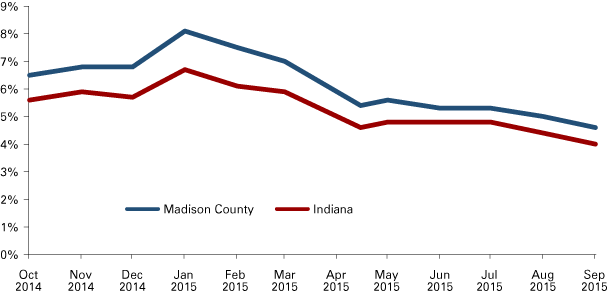
The same trend is observable over the last year. Figure 2 shows the unemployment rate gap between Madison County and Indiana as visibly tighter over the last 12 months.
Figure 2: Comparing Indiana and Madison County Monthly Unemployment Rates

Note: Data are not seasonally adjusted. 2015 data are from January to September.
Source: U.S. Bureau of Labor Statistics
Education
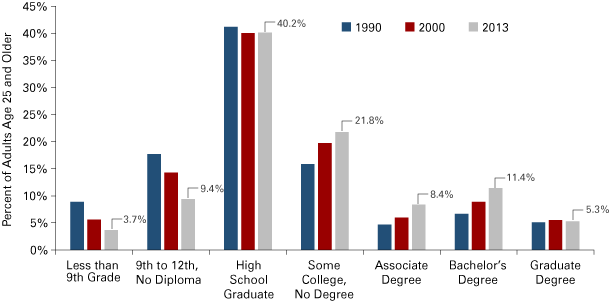
Improvements: Higher earning potential is often correlated to higher educational attainment. Over the last couple of decades, distinct improvements have been made in educational attainment in Madison County. Figure 3 shows the percentage of Madison County residents over 25 years of age with at least some college has improved in several categories.
Figure 3: Madison County Educational Degree Attainment

Source: U.S. Census Bureau, American Community Survey
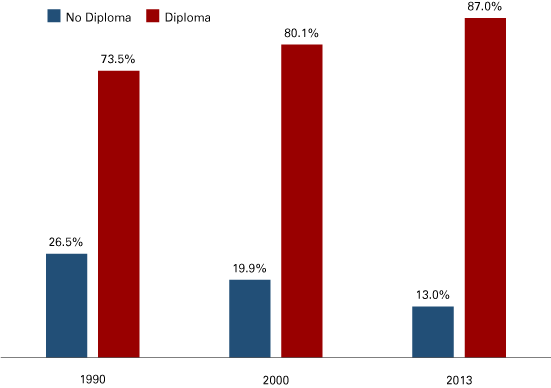
More Diplomas: The proportion of the Madison County population age 25 and older with at least a high school diploma has increased from 73.5 percent to 87.0 percent between 1990 and 2013 (see Figure 4). The percentage of Madison County adults without a high school diploma dropped from 26.5 percent in 1990 to 13.0 percent in 2013.
Figure 4: Percent of Madison County Adults Age 25 and Older by High School Diploma Attainment

Source: U.S. Census Bureau, American Community Survey
Outlook for 2016
Forecast: For 2016, employment in Madison County is expected to continue improving, with a moderate decline in the unemployment rate and a tempered increase in employment. The unemployment rate is projected to drop between 0.8 and 1.4 percentage points in 2016 as the regional economy continues to improve. This number could be a little stronger (in the 1.5–2.0 percentage point range); however, the improving economy will likely draw a number of previously frustrated unemployed workers back into the labor force. The best estimate is an unemployment rate of about 5.1 percent for 2016.
The number of jobs in Madison County is expected to hold steady, increasing about 1.5 percent in 2016. The number of jobs should hit just over 56,500. As the overall U.S. economy continues to recover, Indiana economic indicators will likely continue to lead those of Madison County in 2016. However, it is expected that the gap between Madison County and Indiana will continue to close and will be narrower in 2016 than it has been over the last couple of decades.


