Columbus forecast 2019

Associate Professor of Finance, Indiana University Division of Business, Indiana University–Purdue University Columbus

Visiting Associate Professor of Management, Indiana University Division of Business, Indiana University–Purdue University Columbus
The Columbus metropolitan statistical area (MSA) has long supported a strong manufacturing-based economy linked to the transportation industry and light vehicle manufacturing. While structural changes have occurred over the years, dependence on these two industries continues as Columbus MSA gross domestic product (GDP) is approximately 50 percent durable goods manufacturing based.1 Columbus has experienced eight years of solid economic growth since the Great Recession, excluding the minor 0.3 percent decline in GDP in 2016, which reflected a 3.5 percent decline in durable goods manufacturing and a 24.2 percent decline in real estate that were partially offset by increases in natural resources and trade.2 With strong business investment plans, another strong year for Cummins, solid consumer confidence and strong (albeit declining) light vehicle sales in North America, Columbus should conclude 2018 on a positive note as we approach 2019.
Key measures
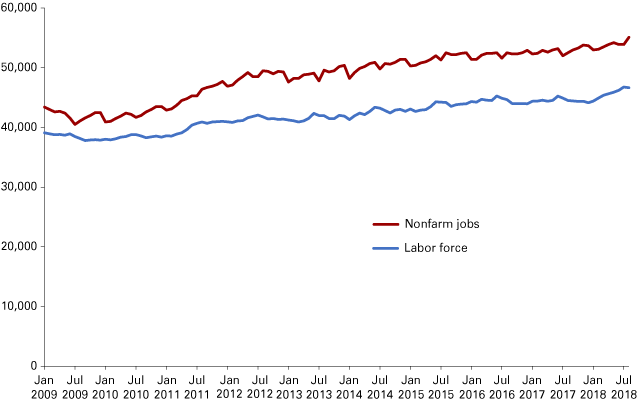
Employment and labor force: Since 2010, the Columbus MSA experienced nonfarm job growth of between 400 and 4,000 annually, resulting in a total increase of 12,600 jobs (see Figure 1). In the last 12 months, job growth of approximately 2,600 positions reflects a 5 percent increase in nonfarm positions.
Figure 1: Labor force and nonfarm jobs, January 2009 to August 2018
Note: Data are not seasonally adjusted.
Source: U.S. Bureau of Labor Statistics
The 55,100 jobs in Columbus attract approximately 9,500 workers (or 15.1 percent of the workforce) from Johnson, Jackson, Jennings, Brown and Marion counties.3 Based on the same 2016 data, approximately 3,000 Bartholomew county residents (or 5.5 percent of the resident labor force) commute to Jackson, Marion, Johnson and Decatur counties for their jobs. Between 11,000 and 12,500 workers from outside Columbus will continue to be required for staffing local firms; therefore, commuting patterns would be expected to remain relatively stable. However, labor supply pressures are expected to increase as new employers, such as Amazon, enter markets in surrounding counties.
Labor force participation: Labor force participation rates for the U.S. and Indiana have remained relatively stable between 62 percent and 65 percent since 2014. The Columbus labor participation rate increased from 2014 to 2017 to a reading of 71 percent.4 This high labor force participation rate reflects the growing tension between job need and talent availability in the area, placing pressure on firms seeking to expand or replace retiring employees. Additionally, pricing pressures may result as the high labor force participation rate coupled with the low unemployment rate results in competition for the limited labor resource pool.
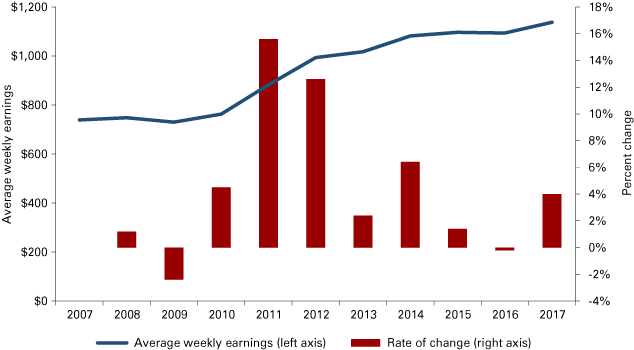
Weekly earnings: Weekly earnings for the Columbus MSA have experienced impressive 56 percent growth from a low of $730 in 2009 to $1,140 in 2017 (see Figure 2). However, as the labor market has tightened between 2014 and 2017, weekly earnings have only increased 5 percent, while inflation (measured by national CPI-U) impacted consumer spending power by 4.5 percent during the same period.5 Average weekly hours have remained relatively stable during this period between 37 hours and 39 hours per week. The rate of growth for average hourly earnings has declined during this same period from 6 percent in 2014 to 2 percent in 2017.6
Figure 2: Average weekly earnings in the Columbus MSA
Source: U.S. Bureau of Labor Statistics and Indiana Department of Workforce Development data
Unemployment: The continuing economic strength in the U.S., Indiana and Columbus pushed the unemployment rate for the U.S. to 3.7 percent in September. Indiana’s unemployment rate for September (not seasonally adjusted) was 3.0 percent,7 the lowest September rate since 2000. Columbus’ September unemployment rate of 2.2 percent (not seasonally adjusted) is also the lowest September unemployment rate since 2000. The Columbus MSA unemployment rate is slightly lower than any of the counties contiguous to Bartholomew, reflecting the solid employment base in this county. Table 1, which shows selected Indiana metros and micros, highlights that unemployment rates across the state are lower than the national average. This table also demonstrates the greater volatility of Indiana’s unemployment rate with changes in national economic trends.
Table 1: September unemployment rate comparison for selected Indiana metros and micros
| 2009 | 2010 | 2011 | 2012 | 2013 | 2014 | 2015 | 2016 | 2017 | 2018 | |
|---|---|---|---|---|---|---|---|---|---|---|
| U.S. | 9.5% | 9.2% | 8.8% | 7.6% | 7.0% | 5.7% | 4.9% | 4.8% | 4.1% | 3.6% |
| Indiana | 10.0% | 9.5% | 9.0% | 7.7% | 6.9% | 5.4% | 4.2% | 4.1% | 3.3% | 3.0% |
| Bloomington | 6.1% | 7.7% | 8.2% | 7.1% | 6.3% | 5.3% | 4.2% | 4.2% | 3.3% | 3.2% |
| Columbus | 10.1% | 8.5% | 7.3% | 5.7% | 5.2% | 3.9% | 3.1% | 3.1% | 2.5% | 2.2% |
| Evansville | 7.9% | 8.0% | 7.6% | 6.9% | 6.3% | 4.8% | 3.7% | 3.9% | 2.9% | 2.9% |
| Greensburg | 9.7% | 10.0% | 9.3% | 8.2% | 7.6% | 5.8% | 4.5% | 4.3% | 3.7% | 2.8% |
| Indianapolis-Carmel-Anderson | 8.7% | 8.9% | 8.7% | 7.5% | 6.6% | 5.2% | 4.0% | 3.8% | 3.1% | 2.9% |
| Kokomo | 13.0% | 11.1% | 10.1% | 8.5% | 7.2% | 5.7% | 4.3% | 4.0% | 3.4% | 3.0% |
| North Vernon | 13.3% | 11.4% | 11.2% | 9.3% | 7.9% | 5.7% | 4.1% | 4.2% | 3.3% | 3.0% |
| Seymour | 11.5% | 9.7% | 8.7% | 6.9% | 5.8% | 4.5% | 3.5% | 3.4% | 2.8% | 2.6% |
Note: Data are not seasonally adjusted and the September 2018 values are preliminary.
Source: U.S. Bureau of Labor Statistics
Planned business investment: Columbus continues with business investment planning, although the level is down from the recent peak in 2015 of $153.2 million. Six projects in 2017 totaling $80.7 million were followed by five projects in 2018 for $107.6 million. Since the Great Recession, an estimated $745 million of planned investment in the Columbus MSA was projected to create an estimated 3,200 jobs (see Table 2). With the planned investments announced in 2018, this business investment trend continues to reflect confidence by local businesses.
Table 2: Columbus MSA planned business investment announcements
| Year | Number of expansions | Planned Investment ($ millions) | Number of employees |
|---|---|---|---|
| 2008 | 3 | 16.05 | 511 |
| 2009 | 0 | 0 | 0 |
| 2010 | 11 | 23.68 | 515 |
| 2011 | 9 | 35.52 | 945 |
| 2012 | 15 | 52.41 | 199 |
| 2013 | 18 | 135.98 | 884 |
| 2014 | 11 | 52.64 | 130 |
| 2015 | 9 | 153.15 | 171 |
| 2016 | 7 | 103.76 | 79 |
| 2017 | 6 | 80.73 | 91 |
| 2018 | 5 | 107.56 | 165 |
Source: Columbus Economic Development Board
Economic indicators
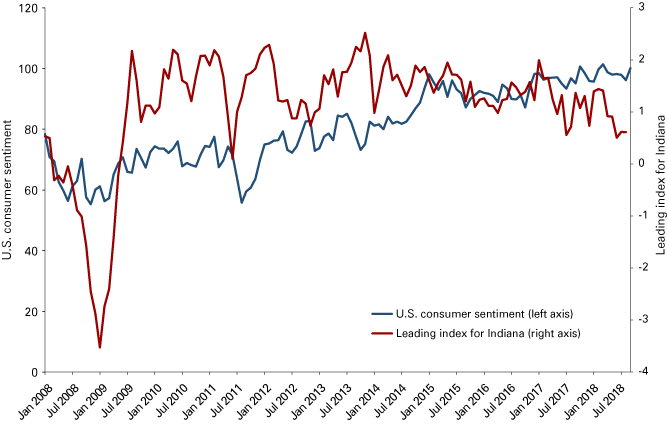
Leading index for Indiana: The leading index for Indiana (LII) has been developed by the Philadelphia Federal Reserve Bank reflecting a six-month forecast that considers nonfarm payroll, average hours worked, the unemployment rate, wage and salary disbursements, housing permits, initial unemployment claims, delivery times and interest rate spreads. The LII has been trending down since reaching a peak of 2.5 in November 2013, reflecting Indiana’s cyclical economy—which is even more pronounced in Columbus, where automotive supply and diesel engine components manufacturing drives the cash-flow bus. Because the LII has been consistently below 1 since April of this year, reaching a low of 0.5 in June, and because the LII has not been this low since 2011 (see Figure 3), this indicator gives pause to the Columbus MSA going forward.
Figure 3: Leading index for Indiana and consumer sentiment for the U.S.
Source: Philadelphia Federal Reserve Bank and the University of Michigan
Consumer sentiment: Consumer sentiment is a leading indicator developed by researchers at the University of Michigan. This indicator continues at a high level, moving over 100 in October 2017, March 2018 and again in September 2018—levels that have not been observed since January 2004 (see Figure 3).8 Consumers’ expectations of economic growth result from improving personal finances buttressed by rising weekly wages and expectations of controlled inflation. One cloud on the horizon for consumers that could adversely affect wages going forward is the largely unknown impact of changes to foreign trade relations and tariffs. Approximately 30 percent of the survey participants voiced tariff-related concerns.9 While the United States–Mexico–Canada Agreement (USMCA) promises to settle much of the anxiety within certain industrial and business discussion circles, the USMCA is quite new—and its rollout yields considerable uncertainty.10 Changes to tariffs causing blockages in international business transactions, particularly as it relates to North American borders, would disproportionately impact the state of Indiana on the whole—and Columbus, specifically, as a production area heavily concentrated in automotive supply—since parts are known to cross international borders several times en route to becoming part of a light vehicle.11
Purchasing Manager’s Index (PMI): The PMI continues hovering around 60 with a reading of 59.8 in September, down 1.5 from August and down 1.0 from the prior year. A reading above 50 indicates the manufacturing economy is expanding. The September reading reflects the continued strong growth in manufacturing from growth in new orders, low customer inventories, production growth and strong consumption. Based on the national supply executive’s index, the overall economy has grown for 113 consecutive months, and manufacturing has been growing for 25 consecutive months.12
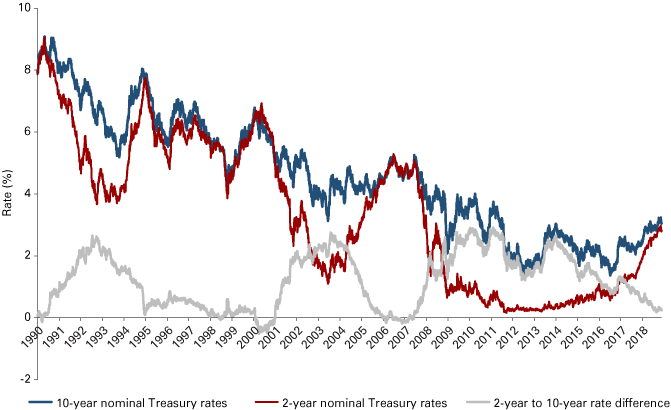
Interest rates and the yield curve: The U.S. Treasury yield curve, reflected in Figure 4, approaches closer to inversion as the spread between two-year notes and 10-year notes continues to decline. Based on recent actions and statements by the U.S. Federal Reserve, short-term rates are expected to continue to increase into 2020, as a mechanism to control inflationary expectations. By the end of 2018, the Federal Reserve will have increased short-term rates 1 full percentage point this year. An additional ½ to 1 percentage point increase in short-term rates is anticipated for 2019.13
Yield curve inversion, where two-year rates are equal to or higher than 10-year rates, has been a predictor of recession.14 Jesse Colombo, an economist and contributor to Forbes, projects the yield curve to invert by the end of 2018.15 As noted by many scholars and economists over the years, historically, recessions often follow inversion by 10 to 20 months.
Figure 4: Two-year and 10-year Treasury rates and the yield curve
Source: U.S. Department of the Treasury
Of particular interest to the Columbus area, increasing interest rates can reduce the demand for durable goods. Automobile and transportation-related purchases decline as interest rates rise due to higher ownership costs and a lower number of consumers qualifying for purchase. This change in demand may precede any decline in GDP as consumers reduce durable goods purchases while maintaining their level of nondurable goods purchases.
Haig Stoddard, an industry analyst, expects that vehicle and light truck sales worldwide should continue growing at approximately 2 percent per year for 2018 and 2019,16 but light vehicle sales throughout North America are expected to enter the final stages of the automotive business cycle going forward from this point. This trend can been seen in Figure 5. Unit sales of light vehicles in China and Europe, both forecast to exceed unit sales in North America in 2018, are expected to grow between 2 percent and 3 percent in 2018 and 2019.17 The 1 percent to 2 percent decline in light vehicle sales in North America and the U.S., however, is not reflected in vehicle production estimates. Depending on tariffs and export potential, this may result in a continued build-up of vehicle inventories in North America.
Figure 5: U.S. monthly vehicle sales with annual trend line
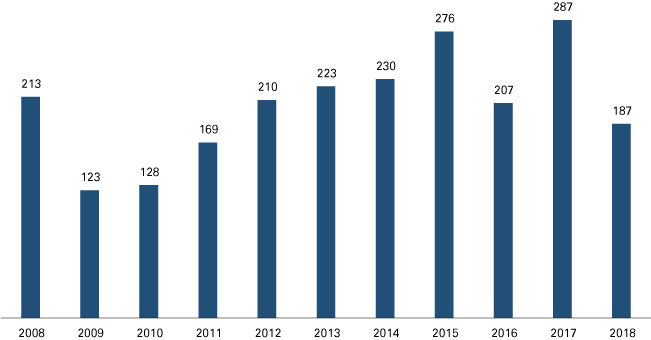
Local building permits: Following a strong fiscal year 2017 for building permits in Columbus (287 permits), residential building permits declined by 35 percent in fiscal year 2018 to a level (187) 10 percent below the 2012 level (210), as shown in Figure 6. The fiscal year 2018 data reflect a return to a relatively normal level of building permits (45) in the October through December time frame from a strong performance in the same period in fiscal year 2017 (128). However, the number of building permits issued year to date in 2018 (January through September) is 142—the lowest level since 2011 (132). Because the building permits growth rate is a leading indicator of economic activity, these declines do not constitute a good omen for the Columbus MSA going forward.
Figure 6: Local fiscal year building permit trends for the Columbus MSA
Note: Data are for the October to September fiscal year.
Source: U.S. Census Bureau
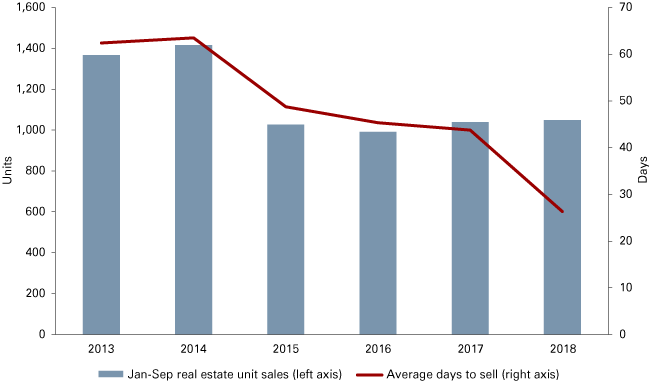
Residential housing sales: Residential housing sales in Columbus have continued below the peak experienced in the 2013-2014 period when inventories remained high from the recession. Residential sales have remained steady at approximately 1,000 units during the first nine months of the year from 2015 to 2018 (see Figure 7). However, as the unit sales declined to this lower level, the average days on the market has declined from an average of about 60 days in 2013 and 2014 to 44 days in 2017 and 26 days in 2018. The reduction in days reflects a tightening of inventory alongside less new construction available for sale. Also noteworthy, the average median price has increased from $134,000 in 2013 to $177,000 in 2018.
Figure 7: Columbus MSA real estate sales and average days on the market
Source: Metropolitan Indianapolis Board of Realtors, National Association of Realtors and Indiana Association of Realtors
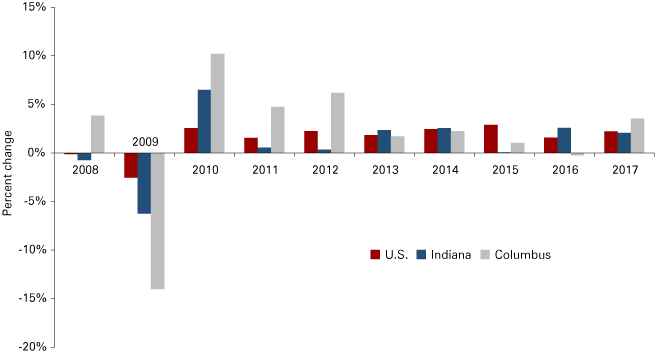
Local real GDP growth: Chained GDP for Columbus increased by 3.5 percent in 2017 after falling slightly in 2016 (see Figure 8). Over the last 10 years, Columbus chained GDP has increased an average of approximately 2 percent per year. This period includes the Great Recession and the strong growth period for Columbus of 2010, 2011 and 2012, where the local economy rebounded in cyclical fashion typical of heavily manufacturing-based economies.
Figure 8: Year-over-year chained GDP growth
Source: U.S. Bureau of Economic Analysis (chained GDP)
However, even with the increase in 2017, the average rate of GDP growth in Columbus has slowed the past three years, falling below the average GDP growth rates for the nation, state, Bloomington and Indianapolis-Carmel-Anderson (see Table 3). This slowing may reflect weakness in demand for recession-vulnerable products produced in the Columbus area.
Table 3: Annual GDP growth rate comparison for selected Indiana metros
| 2014 | 2015 | 2016 | 2017 | 10-year average | 3-year average | |
|---|---|---|---|---|---|---|
| U.S. | 2.5% | 2.9% | 1.6% | 2.2% | 1.5% | 2.2% |
| Indiana | 2.6% | 0.1% | 2.6% | 2.1% | 1.0% | 1.6% |
| Bloomington | 1.0% | 1.1% | 3.1% | 4.7% | 0.8% | 3.0% |
| Columbus | 2.3% | 1.0% | -0.3% | 3.5% | 1.9% | 1.4% |
| Evansville | -2.4% | -0.9% | 1.6% | 1.0% | -0.2% | 0.5% |
| Indianapolis-Carmel-Anderson | 1.0% | -0.2% | 3.7% | 2.5% | 1.2% | 2.0% |
| Kokomo | 1.8% | 1.8% | 0.1% | -2.1% | 0.7% | -0.1% |
Source: U.S. Bureau of Economic Analysis (chained GDP)
Columbus Area Stock Index (CASI): The composition of the Columbus economy may be reflected by an index of publicly traded securities relevant to the community. CASI was developed as a tool to keep abreast of the returns performance of securities affecting the local community and as a tool useful for forecasting local economic conditions.
CASI is an economy-size-weighted index, which weights each component by the number of total jobs estimated to be produced and available in the Columbus MSA. Therefore, securities were selected using area employment as a basis for inclusion in the index. Not all sectors in the local economy were considered. Where the economic condition of a sector was estimated to change relative to some other independent sector, then the dependent sector was excluded.
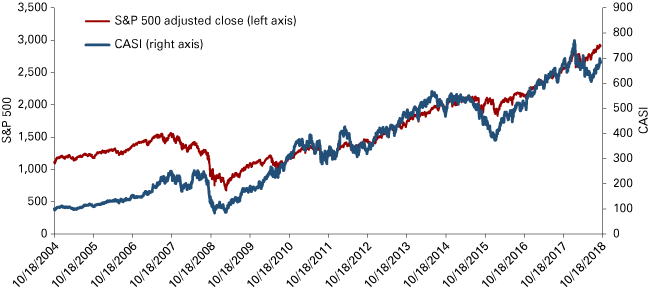
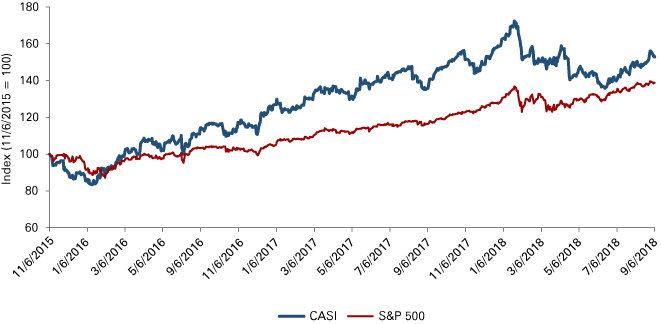
Following the Great Recession, CASI and the S&P 500 generally moved together reflecting strength in the overall market and in valuation of local industries (see Figure 9). However, after declining significantly in 2015, the CASI growth rate during 2016 was three times faster than the S&P 500 and 50 percent faster than the S&P 500 in 2017. In the first nine months of 2018, CASI has declined by 4 percent while the S&P 500 has increased by 8 percent. This divergence from the general market index is linked to significant declines in the manufacturing sector of the CASI, which may reflect the forecasted weakness in light vehicle sales for North America for 2018 and 2019.
Figure 9: CASI and S&P 500 performance comparison since October 2004
Source: Dr. Ryan Brewer and Yahoo Finance
Figure 10 compares the performance of CASI and the S&P 500 over the past several years.
Figure 10: CASI and S&P 500 performance comparison since November 2015
Source: Dr. Ryan Brewer and Yahoo Finance
National and global considerations
National and global issues are intricately coupled as many changes in one nation influence economics in other nations. Oil prices, interest rates and manufacturing in different parts of the world influence and are influenced by actions within the United States.
National issues: As this is an election year, U.S. voters determined the balance of representation within the U.S. Congress. During the past two years, the executive branch of government has benefited from a “friendly” relationship with the legislative branch. The recent midterm elections changed the balance with the House of Representatives controlled by the Democratic party, while the Senate kept a Republican majority. This change to a potentially more adversarial relationship would be expected to further hinder major activities, such as budgets, tariffs and national health care policies, at the federal level. Less progress at the federal government level coupled with increasing interest rates, unemployment rates below the natural rate, and higher prices due to the tariffs and trade wars could dampen economic activity in 2019 and 2020.
Global issues: The USMCA could provide a short-term benefit for U.S. economic growth with provisions for light vehicle production requirements. Global real GDP growth of approximately 3 percent is not unreasonable.18 Yet, China’s GDP growth rate remaining below 7 percent for the past four years and a continuing decline coupled with trade disputes reduce the prospects for export-driven businesses, including Cummins. The more than doubling of oil prices since the lows in January 2016 will also put a drag on world economic activity.19 Because Cummins relies upon China for growth prospects outside its North American trucking business (long and mid-range hauls), this poses a threat to the Columbus economy in 2019.
Outlook
The federal income tax reduction and strong employment should continue to support consumer spending. However, rumors and rhetoric about tariffs and trade wars, increasing interest rates, threats of inverted yield curves and the potential for increasing inflation due to wage pressures could soften the Columbus economy.
Upside potential
Leading general indicators
- The PMI remains above 50, reflecting optimism within the manufacturing sector of the economy.
- Consumer sentiment remains strong, fueling economic growth.
- Columbus MSA GDP for 2017 increased at its fastest rate since 2012.
Additional planned investments: The Columbus Economic Development Board announced in 2018 that five businesses in Columbus plan to spend more than $100 million for expansion, potentially creating more than 165 new jobs.
Cummins: Cummins will be celebrating their 100th year since its founding in 1919. Cummins continues to be the leading manufacturer of commercial diesel engines in North America, with approximately a 40 percent market share—more than double the nearest competitor.20 Importantly, the U.S. and Canada account for approximately 60 percent of the company’s sales. Cummins revenues for 2018 are expected to increase 15-17 percent, with profitability also following this growth trend.21 Components and engine units are expected to lead the revenue growth and strong EBITDA performance for 2018, followed by power systems and distribution.
In the third quarter of 2018, Cummins posted sales of $5.9 billion (up 12.5 percent from the third quarter of 2017), with North American markets rising 17 percent and international business rising 6 percent. Earnings in the third quarter of 2018 were $692 million (up 53 percent from the third quarter of 2017), with $34 million of that coming as a result of the Tax Cuts and Jobs Act of 2017.22 Tariffs increased the cost stack in the third quarter by about $30 million, and costs were largely passed through with strong demand in 2018. Tax benefits and tariffs are essentially a wash—with upside potential existing if a trade deal is negotiated.
The 2019 outlook for Cummins should be strong, with growth led by North American markets, although growth is not expected to be nearly as strong as what was experienced in 2018.
Downside potential
Leading general indicators
- Cummins stock (CMI) has declined in 2018 from a high of $192.50 at the end of January to less than $135 the third week of October. This decline occurred in contrast to strong second-quarter revenues and earnings. The decline in stock price may reflect investor concerns related to two recent truck recalls to address emission-control systems.23
- The Columbus Area Stock Index (CASI) has declined this year, while the S&P 500 has increased.
- Residential housing sales and building permits continue to exhibit weakness for a third year.
Automobile industry: North American light vehicle sales have been declining since reaching a seasonally adjusted peak of 17.8 million during the third quarter of 2015. Current projections reflect further declines for the remainder of 2018 and through 2019.24
Employment base: Continuing the sentiment from the 2018 forecast, Columbus continues to have a high rate of labor force participation, low unemployment and rising wages. With the introduction of additional competitors for employees, such as Amazon in Greenwood, GDP growth may be hindered by the lack of population growth and the number of unfilled jobs.
Forecast
For a second year, Columbus is expected to experience slightly positive real GDP growth for 2019, with performance strongest in the first half of the year. Risks exist that might lead to weaker results. Higher interest rates, fewer building permits on file, tightening of business investment and a further tightening of the labor market will challenge GDP growth. Yet, wage growth will act as a tailwind to output. Unemployment is expected to remain at current levels through much of 2019, with slight job growth balanced by new participants entering the job market. Additionally, declines in North American light vehicle sales and increasing vehicle inventories may influence production in the second half of 2019. These negative pressures will be countervailed somewhat by continued rises in average weekly wages, which may spur retail sales and keep durable goods sales levels from falling harder than we would like.
As the current American expansion will soon be entering its all-time-record 10th year, we might revisit an old cliché from Geoffrey Chaucer—perhaps expressed here and now, as a question: Must all good things come to an end?
Notes
- U. S. Bureau of Economic Analysis data.
- See note 1.
- STATS Indiana Annual Commuting Trends Profile retrieved from www.stats.indiana.edu/dms4/commuting.asp.
- The U.S. labor force participation rate was retrieved from https://data.bls.gov/timeseries/LNS11300000. Indiana’s rate was gathered from Hoosiers by the Numbers, and the Columbus rate was calculated using U.S. Bureau of Labor Statistics data and U.S. Census Bureau population data.
- U.S. Bureau of Labor Statistics CPI-U data retrieved from https://beta.bls.gov/dataViewer/view/timeseries/SUUR0000SA0;jsessionid=B4563C163FD84ECF5D4D7C657B471472.
- Current Employment Statistics (CES) data retrieved from www.stats.indiana.edu/ces/ces_naics/.
- U.S. Bureau of Labor Statistics data retrieved from www.stats.indiana.edu/laus/laus_view3.html.
- Curtin, R. (2018, October). Preliminary results for October 2018. Surveys of consumers: University of Michigan. Retrieved from www.sca.isr.umich.edu/
- See note 8.
- Long, H. (2018, October 1). U.S., Canada and Mexico just reached a sweeping new NAFTA deal. Here’s what’s in it. The Washington Post. Retrieved from www.washingtonpost.com/business/2018/10/01/us-canada-mexico-just-reached-sweeping-new-nafta-deal-heres-whats-it/
- Tong, S. (2017, March 24). When it comes to NAFTA and autos, the parts are well traveled. Marketplace.org. Retrieved from www.marketplace.org/2017/03/24/world/when-it-cones-nafta-and-autos-parts-are-well-traveled
- Fiore, T. (2018). September 2018 Manufacturing ISM® Report on Business®. Institute for Supply Management.
- Bayly, L. (2018, September 26). Federal Reserve approves its third rate hike of the year. NBC News. Retrieved from www.nbcnews.com/business/economy/federal-reserve-approves-its-third-rate-hike-year-n913206
- Conerly, B. (2018, July 14). The yield curve as recession predictor: Should we worry today? Forbes. Retrieved from www.forbes.com/sites/billconerly/2018/07/14/the-yield-curve-as-recession-predictor-should-we-worry-today/
- Colombo, J. (2018, September 19). Should stock market investors fear the coming yield curve inversion? Forbes. Retrieved from www.forbes.com/sites/jessecolombo/2018/09/19/should-stock-market-investors-fear-the-coming-yield-curve-inversion/
- Stoddard, H. (2018, June 1). Global and U.S. automotive outlook: 2018-2019. Presented to the 25th Annual Automotive Outlook Symposium, Federal Reserve Bank of Chicago. Retrieved from www.chicagofed.org/~/media/others/events/2018/automotive-outlook-symposium/stoddard-pdf.pdf
- See note 16.
- World Bank data retrieved from www.worldbank.org/en/publication/global-economic-prospects.
- Oil prices retrieved October 22, 2018, from www.bbc.com/news/topics/cmjpj223708t/oil.
- Top commercial diesel engine makers, 2016. (2017, August). In R. S. Lazick & V. L. Burton III (Eds.), Market Share Reporter (29th ed.). Farmington Hills, MI: Gale. Retrieved from http://link.galegroup.com/apps/doc/RYJXWL955813157/GDL?u=iulib_iupui&sid=GDL&xid=44090b75
- Cummins, Inc. Second quarter 2018 earnings teleconference.
- Johannesen, K. (2018, October 31). Cummins reports record quarter. The Republic. Print copy.
- Chamaria, N. (2018, August 22). Cummins’ CEO thinks the stock is “significantly undervalued.” Is it time to buy? The Motley Fool. Retrieved from www.fool.com/investing/2018/08/22/cummins-inc-stock-buy-the-dip.aspx
- See note 16.


