Aging of the Indiana Workforce
Economic Research Analyst, Indiana Business Research Center, Indiana University Kelley School of Business
The number of unemployed workers per job opening is dropping steadily as the U.S. economy continues to rebound from the Great Recession. In June 2015, there were 1.6 people looking for work for every job available—lower than the pre-recession December 2007 ratio of 1.8.1
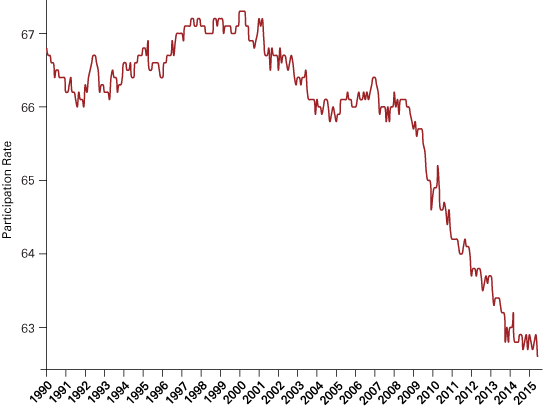
This positive economic trend may have some troubling implications for businesses. A 2015 survey revealed that one in three employers reported difficulty in filling open positions within the past year.2 Factor in dropping labor participation rates (see Figure 1) and baby boomers nearing retirement, and one begins to understand the warnings of impending labor shortages.
Figure 1: U.S. Labor Force Participation Rate, 16 Years and Older
Source: Current Population Survey, U.S. Bureau of Labor Statistics and the U.S. Census Bureau
Here we take a closer look at stable employment in Indiana and our development of an aging-out indicator to investigate whether there may be future labor shortages, and identify which industries and regions are the most vulnerable.
Methodology
Ideally, this analysis would use longitudinal data containing age, occupation, industry and county information on all individuals employed in Indiana to gain a comprehensive look at occupation, industry and regional shifts in labor force ages.
The unavailability of these data on an annual basis necessitated the use of national Quarterly Workforce Indicator (QWI) data, which measures the longitudinal work history—including age range, industry of employment and county—of individuals over time, as reported by their employers through the unemployment insurance system.
QWI data are compiled by the U.S. Census Bureau from Longitudinal Employer-Household Dynamics (LEHD) microdata, Unemployment Insurance (UI) earnings data, Quarterly Census of Employment and Wages (QCEW), Business Dynamics Statistics (BDS), the 2000 Census, Social Security administrative records, and individual federal tax returns.
QWI counts of stable employment were used at the North American Industry Classification Systems (NAICS) subsector level (three-digits) for two time periods: 2001-2003 and 2011-2013. Stable employment is defined as an individual being employed with the same employer for at least three consecutive quarters. The quarterly stable employment counts were aggregated to the economic growth region (EGR) level, and were then averaged by year to arrive at annual estimates.
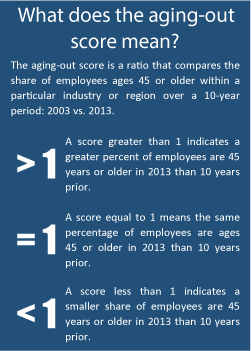
Industry and EGR combinations with less than an average of 10 stable employees per year were suppressed in order to avoid magnifying small shifts in employee ages over time. An aging-out score was determined for all non-suppressed industry and EGR combinations by calculating the ratio of the average industry proportion of stable employees 45 years or older during the 2011-2013 time period vs. the 2001-2003 time period. We will refer to these time periods as 2013 and 2003, for convenience.

Emp45t = Annual average of stable employees ages 45 years or more in year t, industry i and EGR j
TotEmpt = Total annual average of all stable employees in year t, industry i and EGR j
Statewide Results

Statewide, 89 of the 98 (non-suppressed) industries posted aging-out ratios greater than 1. This indicates that ever-growing proportions of employees are 45 years old or more.
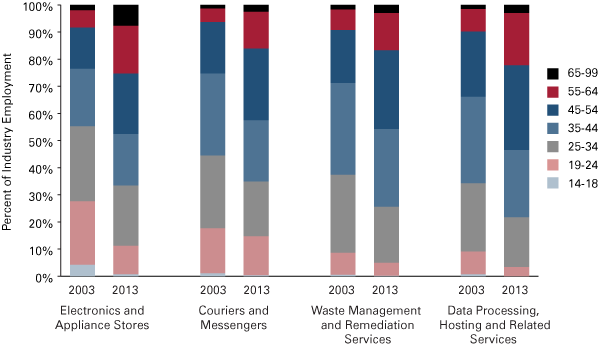
The industries with the highest aging-out indicators are electronics and appliance stores (2.02), couriers and messengers (1.68), waste management and remediation services (1.59) and data processing, hosting and related services (1.58).
Figure 2 displays the average age distribution of these industries. It is important to note that industries with the highest aging-out scores do not necessarily encompass the highest percentage of employees ages 45 and older, nor does it indicate the industries with the greatest share of employees close to retirement. Instead, the aging-out score measures the change in the proportion of employees 45 years and older between the two time periods.
Figure 2: Age Distributions of Industries with the Highest Aging-Out Scores in Indiana

Source: IBRC, using Longitudinal Employer-Household Dynamics data from the U.S. Census Bureau
The industries with the lowest statewide aging-out scores are leather and allied product manufacturing (0.90), administration of human resource programs (0.90), oil and gas extraction (0.92), and private households (0.94).
Economic Growth Region Results
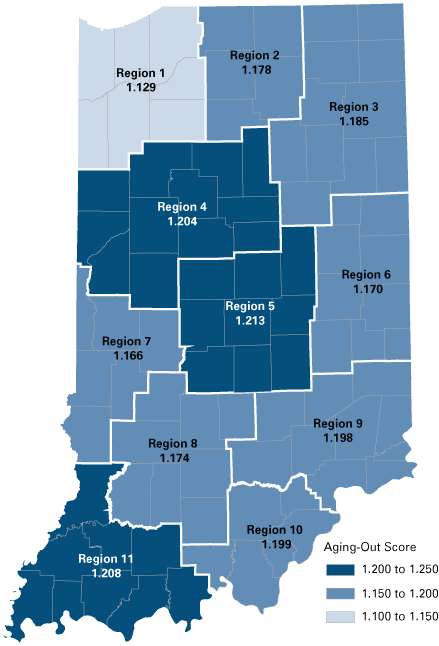
The workforce in Indiana has aged in every economic growth region. Region 5, which includes Indianapolis, has the highest aging-out score across all industries, while Region 1, near Chicago, has the lowest aging-out score (see Figure 3).
Figure 3: Aging-Out Scores for Indiana’s Economic Growth Regions

Source: IBRC, using Longitudinal Employer-Household Dynamics data from the U.S. Census Bureau
The majority of aging-out scores for Indiana EGRs and industry combinations fall within the 1.0 to 2.0 range (see Figure 4) and most industries have similar aging-out scores across regions. Some notable exceptions include:
- Forestry and logging in Region 8 (8.75)
- Beverage and tobacco manufacturing in Region 3 (4.31)
- Performing arts, spectator sports and related industries in Region 9 (2.99)
- Air transportation in Region 11 (2.764)
- Motion picture and sound recording in Region 7 (0.00)
Motion picture and sound recording in Region 7 (0.00) was the lowest scoring industry and region combination, indicating an unusual trend of reverse aging. Even with stable employment counts exceeding 45 each year, there were no recorded employees ages 45 or older during the 2013 time period. The two highest regional aging-out scores from forestry and logging and beverage and tobacco manufacturing should be tempered by the specifics of the particular region and industry combinations, which reveal that both of these aging-out values were close to the suppression threshold due to low annual employment. These high aging-out values constitute only a small portion of the total employment within the overall regions and industries.
Figure 4: Aging-Out of Indiana’s Industries
Source: IBRC, using Longitudinal Employer-Household Dynamics data from the U.S. Census Bureau
Focusing on Indiana’s largest industries reveals more stable aging trends. Of the seven industries employing the largest number of employees, all but one of the industry and region combinations have aging-out scores of less than two (see Figure 5). Results such as these indicate no impeding labor shortages for Indiana’s major industries. However, the transportation equipment manufacturing industry in Region 11 may need to focus on hiring younger employees, as its aging-out score is 2.303 and its employment in that region has grown 50 percent between 2003 and 2013.
Figure 5: Aging-Out of Indiana's Industries with the Largest Employment
Source: IBRC, using Longitudinal Employer-Household Dynamics data from the U.S. Census Bureau
For a full table of the aging-out scores, annual average of stable employees, and whether the number of stable employees remained consistent between the two time periods, please refer to the appendix at www.ibrc.indiana.edu/ibr/2015/fall/appendix.html.
Recommendations
Similar to the national trend, Indiana’s labor force is aging in all regions and nearly every industry. While the aging is more pronounced for certain industries and regions, none of the highest aging values are in dominant industries in the Indiana economy, and overall, the aging-out scores do not indicate dramatic trends over the 10-year period from the early 2000s to the early 2010s.
Nevertheless, these slow and steady aging trends will require action in order to avoid future labor shortages. Education, training and apprenticeship programs will play an important role in mitigating or eliminating workforce gaps and preparing the future labor force of Indiana. Industry research to ensure programs such as these properly equip individuals with the necessary skills is vital. Additionally, these programs must remain flexible in order to adapt to emerging industries and technological advancements. Creation of effective education, training and other programs will make Indiana more competitive to attract young talent in the state. However, in order to retain such talent, Indiana’s economy must offer competitive jobs in desirable fields with advancement opportunities.
Notes
- U.S. Bureau of Labor Statistics, “Job Openings and Labor Turnover Survey Highlights: June 2015,” August 12, 2015, www.bls.gov/jlt/jlt_labstatgraphs_june2015.pdf.
- Manpower Group, “10th Annual Talent Shortage Survey,”.


