The Long View: Does Research and Development Drive the State’s Economy?
Economic Research Associate, Indiana Business Research Center, Indiana University Kelley School of Business
Director of Economic Analysis, Indiana Business Research Center, Indiana University Kelley School of Business
Not infrequently, one gets asked by a reporter, or even an aspiring reporter: What is holding Indiana back economically? The question may be motivated by Indiana’s relatively poor per capita personal income or by an honest investigation about whether economic policies, past or present, will bear fruit.
The topic of innovation is often broached in tandem with research and development (R&D). Is the state losing ground in the race to develop, market and produce new products and services? Innovation today will lead to economic growth tomorrow, so the theory goes. Will innovation initiatives today have an effect on the state’s longer-term economic outlook?
We consider this question here by exploring one facet of the innovation landscape: the state’s activity and strength in research and development. Often, the efficacy of research and development expenditures is measured in terms of patent production. The correlation between the two is almost self-evident. But note, a patent and its intellectual content can be developed in one place and applied in another. Massachusetts can be a patent or R&D making location, but another location (e.g., a manufacturing state) can be a patent or R&D using location. This distinction may be helpful in interpreting the degree to which a state’s R&D intensity drives broader economic growth.
First, a quick description of the data and the method we use to gain insights. For research and development intensity, we use National Science Foundation data on R&D expenditures on science and engineering. To make the comparisons fair (we do not want states with large populations to get an unfair advantage), these data are scaled by number of workers. Current-dollar (cu$) GDP is likewise scaled at the aggregated state level. GDP, recall, is all the value-added associated with production. The vast majority of GDP is in the form of salaries, wages and benefits—although it also includes dividends, profits, rents and royalties. We also compare GDP annual growth rates in two critical sectors: manufacturing and professional, scientific and technical services.
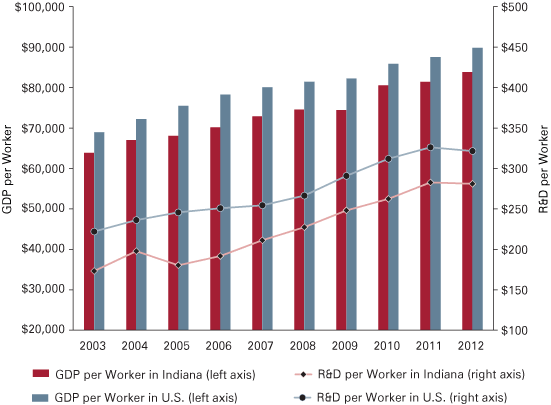
Not to spoil the movie, but the innovation outlook related to R&D for Indiana is mixed. From 2003 to 2012, Indiana was below the national averages for both R&D spending per worker in science and engineering and GDP per worker. That said, Indiana is not falling further behind. As Figure 1 shows, Indiana follows nationwide growth rate trends for both measures, with the exception of a decrease in R&D spending in 2005 that most other states did not experience.
Figure 1: GDP and R&D Spending per Worker in Indiana and the U.S.
Source: National Science Foundation Survey of Research and Development Expenditures at Universities and Colleges/Higher Education Research and Development Survey and the U.S. Bureau of Economic Analysis
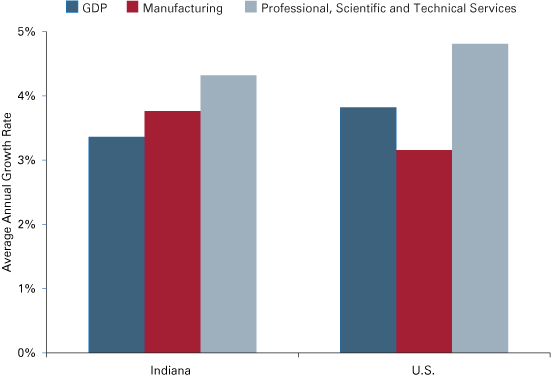
Aggregated totals may not tell the whole story. While Indiana’s currentdollar GDP average annual growth rate since 2003 is a smidge lower than the United States, it has a higher growth rate in the manufacturing sector (see Figure 2). In professional, scientific and technical services, however, the rate of growth is not up to the national rate. The share of this industry is below the national average and is growing more slowly than the nation as a whole. This difference in growth in these two sectors brings up a relevant point on how it appears Indiana is performing. The state is doing just fine in terms of R&D using (i.e., manufacturing). R&D making is not the state’s strong suit compared to the nation.
Figure 2: GDP and Selected Sector Average Annual Growth Rates, 2003 to 2012
Source: U.S. Bureau of Economic Analysis
Using data at the national level, we find a positive correlation between R&D per worker and GDP per worker. That is, these two data series move together: where there is greater R&D, there tends to be greater GDP. (One needs to be mindful that correlation does not imply causality.) While there is a positive statistical relationship between higher levels of R&D and levels of GDP, there is no such relationship (correlation) over time between changes in the ratio between R&D expenditures per worker and GDP per worker. Stated differently, an increase in R&D per worker does not immediately translate into greater GDP per worker, at least over this (relatively short) time period.
We did not investigate whether there is a time lag in terms of accelerating R&D and accelerating GDP as this would require an analysis of a much longer time period. (One would expect that it would take several years before R&D would be embodied in new or improved products. This is especially the case for pharmaceuticals that undergo many years of safety and effectiveness testing.)
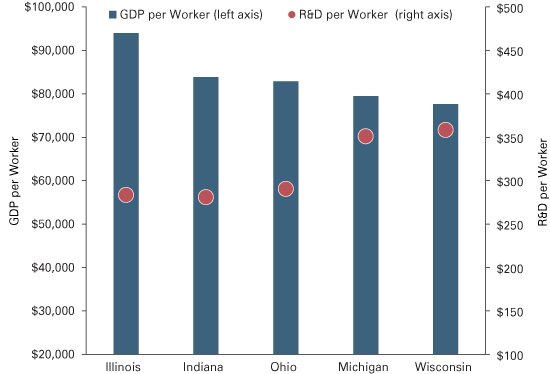
Comparing Indiana to neighboring states in the Great Lakes region, we see that Indiana is second behind Illinois in terms of GDP per worker, but has the lowest average R&D per worker in 2012 (see Figure 3). This was the case in previous years as well. Wisconsin has the greatest R&D expenditures per worker among this group. In the Great Lakes region, in contrast to the nation as a whole, there does not appear to be a clear relationship between GDP per worker and R&D expenditure levels.
Figure 3: R&D and GDP in the Great Lakes Region, 2012
Source: National Science Foundation Survey of Research and Development Expenditures at Universities and Colleges/Higher Education Research and Development Survey and the U.S. Bureau of Economic Analysis
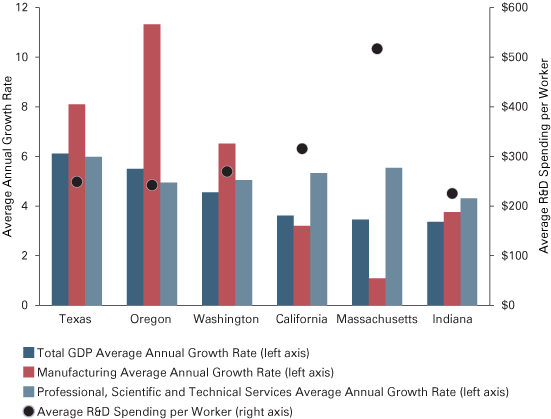
Finally, how does Indiana compare to a select set of high-performing states? It is not a simple story, as there are clearly differences that are contingent upon a state’s dominant industries. (For example, many states enjoyed a boom in resource extraction.) Of the selected states in Figure 4, Indiana has the lowest average R&D spending across the 10-year span. A couple of the selected states had a particularly strong manufacturing run over the last decade that translated into a better-than-average rate of economic growth overall.
Figure 4: Average GDP Annual Growth Rate and R&D Spending for Indiana and Selected States, 2003 to 2012
Source: National Science Foundation Survey of Research and Development Expenditures at Universities and Colleges/Higher Education Research and Development Survey and the U.S. Bureau of Economic Analysis
The economic growth in California and Massachusetts, however, was driven by something other than robust growth in manufacturing output per worker. Perhaps it was the result of a much greater concentration in the professional, scientific and technical services industry. Massachusetts’ economic output concentration is almost twice the national average in this industry. California is above the national average. Indiana had the lowest professional, scientific and technical services growth rate of the selected states.
Here again, in a state-to-state comparison, we may see a clear differentiation between R&D making and R&D using states. Indiana’s R&D concentration lags national averages and lags higher-performing states. The upshot of being an R&D using state is that average wages and salaries in manufacturing are typically lower than in higher-tech, R&D making industries like professional, scientific and technical services.
It would not be wise to make definitive statements on the longer-term economic outlook based on this broad (and brief) overview of R&D expenditures and related industries in the state, but one can express some concern about Indiana’s relative status in terms of innovation capacity. Being an R&D using manufacturing powerhouse, has served the state well in the past. But wouldn’t Indiana have an even brighter future if the state was a powerhouse in both R&D using and R&D making?


