Bloomington Forecast 2015
Director, Indiana Business Research Center, Indiana University Kelley School of Business
Despite an unusually rocky start to 2014, this year has generated respectable, if modest, economic growth in the Bloomington area. Employment gains have proven elusive, but encouraging signs of growth are evident.
Mixed Economic Growth

A year ago the economy of the Bloomington metropolitan area was growing—slowly, to be sure, but on an upward trend. The latest advance estimate of the metro area’s real gross domestic product (GDP), however, indicates the local economy shrank in 2013 by about half a percentage point to just over $6 billion—essentially flat.1 Total real GDP has been essentially unchanged in the past five years. However, due to continued population growth locally, Bloomington’s GDP per capita has declined by 3 percent from its 2009 level, compared to a 4.5 percent growth nationally.
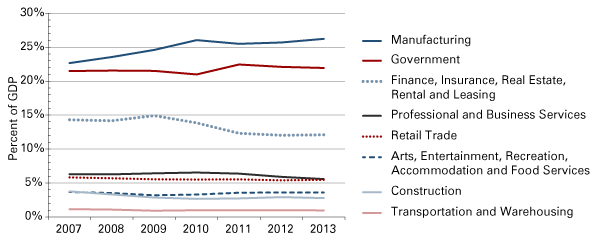
Output from Bloomington’s manufacturing sector has greatly outperformed other sectors, up 21 percent over 2007, just before the Great Recession began. The recession tapped the factory brakes only lightly, and last year manufacturing regained its previous peak, accounting for more than 26 percent of the total local economy.
As seen in Figure 1, government remains the area’s second-largest sector, consistently generating around 22 percent of local GDP the last several years. Next-largest is the finance, insurance, real estate, rental and leasing sector, which took a big recession hit and has now leveled off at just 12 percent of the metro economy. Though local GDP data are not reported for separate industries within this sector, the real estate and financial crashes no doubt took a toll, even in relatively stable Bloomington. Accordingly, output of the local construction sector has yet to return to pre-recession levels.
Figure 1: Shares of Real GDP in the Bloomington Metro

Source: IBRC, using U.S. Bureau of Economic Analysis data
Among the smaller sectors, professional and business services were growing prior to the recession, but they have shrunk somewhat since 2010. Retail, in contrast, has doggedly maintained its share of the economic pie, as have the entertainment and hospitality industries.
Job Growth Sluggish, but Wages Rising
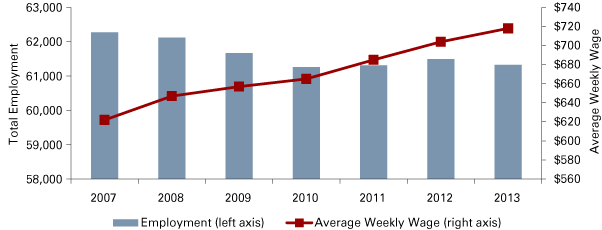
Monroe County had more than 62,000 workers on payrolls in 2007, but three years later that number had shrunk by 1,000. In the recovery years since, payroll jobs have hovered in the low 61,000 range. Sectors with notable job shrinkage from 2007 to 2013 include construction (-29 percent), professional and business services (-27 percent), wholesaling (-13 percent), and financial activities (-8 percent). In contrast, sectors showing appreciable growth include private educational services (+19 percent), health care and social assistance (+18 percent), utilities (+16 percent), leisure and hospitality (+12 percent), and local government (+6 percent).
While total employment has been moribund, there’s been an encouraging, steady rise in average wages for those still on payrolls, as seen in Figure 2. The average weekly wage has climbed by nearly $100 (+15 percent) since 2007. Leading the charge is professional and business services, up 43 percent, followed by utilities (+25 percent), financial activities (+21 percent), construction (+19 percent) and wholesaling (+17 percent). Since most of the wage gains have occurred in shrinking sectors, one suspects that these sectors tended to shed jobs at the lower end of their pay scales.
Figure 2: Monroe County Employment and Wages

Source: IBRC, using Quarterly Census of Employment and Wages data from the U.S. Bureau of Labor Statistics
Monroe County’s unemployment rate was 4.7 percent in September 2014, close to its lowest level since 2008 and continuing a generally downward trend that peaked at over 8 percent in 2010. Even at its highest, the local unemployment rate has remained well below Indiana’s hardest-hit areas.
Personal Income Rising Slowly
The most recent data on personal income reveal that the Bloomington metro area’s per capita personal income (PCPI) grew by 4.0 percent in 2012, better than the growth rates of the U.S. (3.4 percent) and the all-metro-areas average (3.3 percent). Despite this commendable growth, however, Bloomington’s PCPI of $32,837 ranked only 337th out of 381 metro areas nationally; the national average was $43,735.
In terms of total personal income, 2012 was a moderately good year, with local area income rising 4.5 percent (comparable to 2011). Net earnings continued to account for 63 percent of the $5.3 billion metro total, while the share generated by investment income declined a couple of points to 19 percent. This was counterbalanced by a 2 percent share increase (to 16 percent) for government retirement benefit payments, reflecting a growing portion of the workforce entering retirement.
Housing Market Warming
Despite the challenge of selling homes during last winter’s polar vortex, 2014 home sales are on pace to finish strong. Though Monroe County sales were down 3 percent from October 2013 through September 2014 compared to the same 12 months a year earlier, sales were actually up slightly the last three months, while new listings rose 10 percent and home sale prices were up 5 percent.
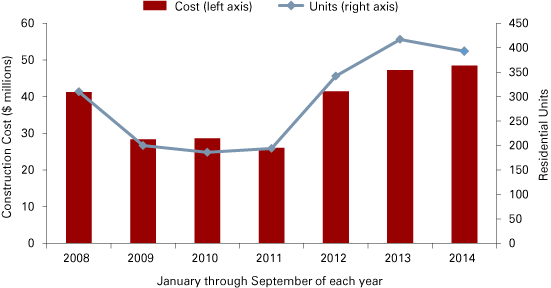
Reflecting this improved mood in the housing market, local residential construction has shown good gains the last couple of years: 2014 to-date is only slightly behind 2013’s pace, despite the protracted market freeze early in the year. Figure 3, comparing January-to-September periods year to year, shows that 2014 is within a few percentage points of last year for building permits, and actually slightly above 2013 for the value of construction. With normal activity the rest of the year, 2014 could end up as the best year since the housing market crash.
Figure 3: Monroe County Residential Building Permits

Source: IBRC, using U.S. Census Bureau data
The Year Ahead
Modest growth is predicted for the Bloomington area in 2015, driven by continued population growth, generally improving economic conditions nationally and statewide, and the nature of the local economy. This will be reflected more in incomes than in employment per se, as firms under recession pressures have found ways to increase their productivity, thereby not needing as many employees as they once did. Some job growth is expected nonetheless.
We forecast local payroll employment to add about 1,000 to 1,500 jobs next year, with average wages rising 3 to 4 percent. Personal income (for 2013, once the data are released by the U.S. Bureau of Economic Analysis) should rise around 4 percent reflecting increased hiring, more people receiving retirement benefits and positive returns on investments. Finally, the housing market will see further growth in construction, home sales and prices—evidence that Bloomington remains an attractive place to live.


