Gary Forecast 2014
Assistant Professor of Economics School of Business and Economics, Indiana University Northwest
The economic changes in Northwest Indiana in 2013 have been mixed. While some areas of the economy have rebounded and even exceeded pre-recession levels, such as the health care industry, others still lag far behind, such as manufacturing. For the purpose of discussing the regional economy, the “Gary metro area” of Northwest Indiana is defined by the U.S. Census Bureau as the following counties: Lake, Porter, Jasper and Newton (La Porte County is now the Michigan City metro).
When discussing the economic conditions of this area, one particularly useful tool is the Northwest Indiana Coincident Index which is published monthly by the School of Business and Economics at Indiana University Northwest.1 This index measures the current pulse of the economy and forecasts the future growth of the region. The Coincident Index is modeled after state and federal coincident indices published by the Federal Reserve Bank of Philadelphia.2
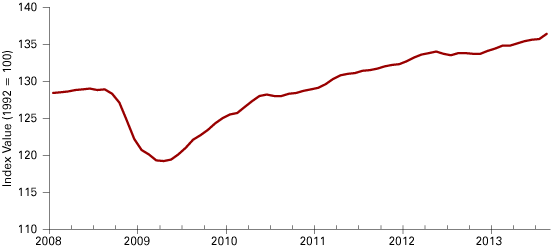
Based on the Northwest Indiana Coincident Index, the economy in Northwest Indiana grew 1.6 percent between August 2012 and August 2013. Figure 1 shows the Northwest Indiana Coincident Index since 2008. In August 2013, the index rose to a new high of 136.4. While this is favorable news, this growth is less than the 2 percent growth that was forecasted one year ago by the index. Furthermore, Northwest Indiana grew at a slower pace than both the state of Indiana and the nation during this same time period. The coincident indices published by Federal Reserve Bank of Philadelphia show the state of Indiana grew by 3.3 percent and the United States grew by 2.9 percent.
Figure 1: Northwest Indiana Coincident Index, January 2008 to August 2013

Source: Northwest Indiana Coincident Index
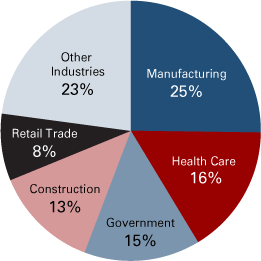
The slower economic growth in Northwest Indiana can primarily be attributed to the types of jobs in the region, particularly the high concentration of employment in manufacturing. Figure 2 shows the top five industries by earnings in the Gary metro area. These industries are manufacturing, health care, government, construction and retail trade. More than 25 percent of earnings in Northwest Indiana come from manufacturing jobs. This high concentration of earnings and employment in a single industry means it is harder for the region to adapt to changing economic conditions as all our eggs, so to speak, are in one basket.
Figure 2: Top Five Industries by Earnings in the Gary Metro Area, 2011

Source: Bureau of Labor Statistics, Current Employment Statistics
It is hard to overestimate the significance of this concentration of manufacturing jobs in Northwest Indiana. Lake and Porter counties, which comprise 93 percent of the population in the Gary metro, have a location quotient for manufacturing of 23.6: employment in these counties is 23.6 times more concentrated in manufacturing than the nation as a whole.3 For comparison, the state of Indiana has a location quotient for manufacturing of 4.8, which by national standards is considered high. Because of this high concentration of employment in manufacturing, particularly primary metal manufacturing, the financial crisis—which slowed national and international demand for steel and other metal manufactured goods—hit northwest Indiana particularly hard.
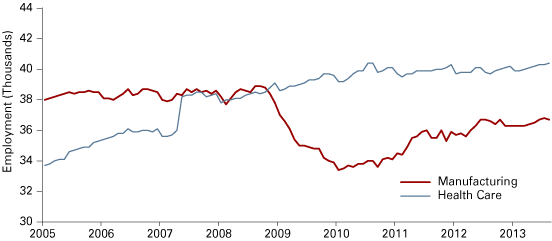
Figure 3 shows employment in manufacturing for the Gary metro area since 2005. Following the U.S. financial crisis of 2007–2008, the region began to hemorrhage manufacturing jobs. In the year 2009 alone, the region lost 5,500 manufacturing jobs (14 percent of all manufacturing jobs and 2 percent of all jobs). While the region has made some gains since then, recovering about 60 percent of the manufacturing jobs lost, employment has not yet returned to pre-recession levels.
Figure 3 also shows one of the bright spots for the region, employment in health care and social assistance. Since the beginning of 2007 the region has added 4,500 new jobs in the health care industry, an increase of 12.5 percent. While these new jobs partially offset the loss of manufacturing jobs, service related jobs tend to be lower paying than manufacturing jobs and this has limited the recovery. Ultimately, however, the health care industry will play a more important role in regional growth in the future.
Figure 3: Gary Metro Employment in the Top Two Industries, January 2005 to August 2013

Source: U.S. Bureau of Labor Statistics, Current Employment Statistics
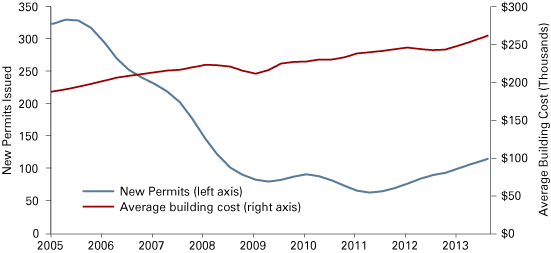
Another bright spot in the region’s economy is the housing market. Figure 4 shows the number of new residential construction permits issued monthly in the Gary metro area since 2005. Between 2005 and 2011, the number of monthly residential permits issued fell by almost 80 percent. Since 2011, the number of new permits issued each month has been consistently increasing. Figure 4 also shows the average construction cost of new residential buildings, which has been consistently increasing since 2005—aside from minor decreases in 2009 and 2012.
Figure 4: Monthly New Residential Construction in the Gary Metro, January 2005 to August 2013

Note: Data are seasonally adjusted
Source: U.S. Census Bureau, Seasonally Adjusted
While the financial crisis hit Northwest Indiana especially hard, there have been some signs lately that the regional economy is recovering, though at a pace slower than the state and national economies.
In conclusion, the Northwest Indiana Coincident Index can be combined with a number of leading indicators to construct a forecast for the growth of the economy and employment in 2014. Table 1 shows forecasted growth in the economy and employment for 2014, along with forecasted and actual growth for 2013. Based on the index, the Northwest Indiana economy is forecasted to grow 2.2 percent in 2014 and regional employment is forecasted to increase by 0.8 percent, the equivalent of 2,000 new jobs. While economic expansion and new jobs are always desirable, growth at this rate would still leave the region approximately 16,000 jobs (or 5 percent) below the employment high in 2007.
Table 1: Northwest Indiana Regional Forecasts, 2014
| Actual | Forecast | ||
|---|---|---|---|
| 2013 | 2013 | 2014 | |
| Economy | 1.6% | 2.0% | 2.2% |
| Employment | -0.7% | -0.4% | 0.8% |
| -1,900 jobs | -1,100 jobs | 2,000 jobs | |
Source: Author’s Calculations
Notes
- The Northwest Indiana Coincident Index is released monthly at www.nwiindex.com.
- United States Coincident State Index, Federal Reserve Bank of Philadelphia
- Location quotient data comes from the Bureau of Labor Statistics and is defined as the ratio of manufacturing employment to total employment in the analysis area compared to the same ratio for the nation.
Also in this Issue…
- International Outlook for 2014
- U.S. Outlook for 2014
- Financial Outlook for 2014
- Housing Outlook for 2014
- Indiana's Outlook for 2014
- Indiana's Agricultural Outlook for 2014
- Seeking Escape Velocity—Job, Income and Productivity Forecasts
- Anderson Forecast 2014
- Bloomington Forecast 2014
- Columbus Forecast 2014
- Evansville Forecast 2014
- Fort Wayne Forecast 2014
- Gary Forecast 2014
- Indianapolis-Carmel Forecast 2014
- Lafayette Forecast 2014
- Louisville Forecast 2014
- Muncie Forecast 2014
- Richmond Forecast 2014
- South Bend and Elkhart Forecast 2014
- Terre Haute Forecast 2014


