Fort Wayne Forecast 2014
Director, Community Research Institute, Indiana University–Purdue University Fort Wayne
After posting solid numbers in the first quarter years of 2010–2011 (4,097 jobs) and 2011–2012 (3,279 jobs), employment growth in the Fort Wayne MSA flattened off more recently, shedding 236 jobs between the first quarters of 2012 and 2013.
Employment Situation
As shown in Table 1, losses in logistics and construction were offset by gains in health care and manufacturing. Contraction within the professional and technical services and information sectors further challenge economic diversification efforts to boost the region’s average annual wage, which remained flat over the last year at $41,528.
Table 1: Fort Wayne MSA Covered Employment, 2012 Q1 to 2013 Q1
| Industry | Employment | Change 2012 Q1 to 2013 Q1 | 2013 Q1 Average Annual Wage | ||
|---|---|---|---|---|---|
| 2012 Q1 | 2013 Q1 | Number | Percent | ||
| Total | 193,163 | 192,927 | -236 | -0.1% | $41,528 |
| Manufacturing | 33,057 | 33,465 | 408 | 1.2% | $57,077 |
| Health Care and Social Services | 31,296 | 32,884 | 1,588 | 5.1% | $45,219 |
| Retail Trade | 21,389 | 21,330 | -59 | -0.3% | $24,264 |
| Accommodation and Food Services | 16,270 | 16,478 | 208 | 1.3% | $13,611 |
| Educational Services | 15,482 | 15,033 | -449 | -2.9% | $35,056 |
| Administrative Support and Waste Services | 10,629 | 10,122 | -507 | -4.8% | $22,851 |
| Wholesale Trade | 9,298 | 9,576 | 278 | 3.0% | $50,012 |
| Transportation and Warehousing | 10,448 | 9,170 | -1,278 | -12.2% | $42,690 |
| Finance and Insurance | 8,485 | 8,572 | 87 | 1.0% | $73,965 |
| Construction | 7,974 | 7,680 | -294 | -3.7% | $43,210 |
| Public Administration | 6,130 | 6,151 | 21 | 0.3% | $45,452 |
| Professional and Technical Services | 6,288 | 5,915 | -373 | -5.9% | $49,134 |
| Other Services | 5,753 | 5,634 | -119 | -2.1% | $24,628 |
| Information | 3,783 | 3,672 | -111 | -2.9% | $53,368 |
| Real Estate, Rental and Leasing | 2,110 | 2,200 | 90 | 4.3% | $34,091 |
| Arts, Entertainment and Recreation | 1,778 | 1,889 | 111 | 6.2% | $19,295 |
| Management of Companies | 1,607 | 1,787 | 180 | 11.2% | $71,270 |
| Utilities | 479 | 476 | -3 | -0.6% | $110,451 |
| Agriculture, Forestry, Fishing and Hunting | 370 | 383 | 13 | 3.5% | $27,131 |
Note: Some sector data is partially suppressed. The above chart does not include mining and unallocated job estimates. These quarterly estimates include only covered employment. Monthly estimates which include a broader definition of employment estimate Fort Wayne MSA employment to be 211,500 for August 2013.
Source: STATS Indiana, using Indiana Department of Workforce Development data aggregated by the Indiana Business Research Center.
Manufacturing remains the region’s largest employer, with health care close behind. While the health care sector both locally and nationally exhibited strong growth, manufacturing in the Fort Wayne MSA diverges from national trends. Since 2000, the national manufacturing sector has declined by 31 percent. During this time, the Fort Wayne MSA’s manufacturing sector contracted by 25 percent, declining from about 44,500 jobs to 33,500 jobs (-11,000). According to the National Bureau of Economic Research, the Great Recession officially lasted from December 2007 until June 2009. So, what’s happened since 2009? The national manufacturing sector has been sluggish, creating only 72,000 jobs (representing 0.6 percent growth). In the Fort Wayne MSA, the manufacturing job base has expanded by 10 percent, adding nearly 3,000 new jobs, which pay an average wage higher than that for the region.1
The Community Research Institute tracks business expansions, relocations and closings among the region’s major employers and those in targeted industries. Recent notable events include an expansion of aluminum components provider 80/20 Inc. ($11 million investment, 90+ new jobs) and a new Fort Wayne location for Accelerated Tanks and Trailers ($4.2 million investment, 300+ new jobs). Bolstering the transportation and logistics sector, Sweetwater Sound is currently underway with a $23.6 million expansion that will support more than 300 new jobs. The region’s insurance cluster also registered a win with Ash Brokerage’s recent announcement to locate its headquarters in downtown Fort Wayne, partnering with Hanning & Bean Enterprises to construct a $71 million mixed-use office, retail and residential complex.
Labor Market
In September, the U.S. unemployment rate dipped to 7 percent, representing the lowest point since November 2008 (6.5 percent). The Fort Wayne MSA mirrored these dynamics, with the most recent rate (7 percent in August) also reflecting the lowest point since November 2008 (6.8 percent). As recent commentary by The Brookings Institution points out, the national unemployment rate does not reflect that an estimated 3.4 million workers have dropped out of the labor force.2
Federally reported unemployment rates only capture workers who are (1) currently employed or (2) those that are unemployed but actively looking for work, as measured by unemployment claims. It does not capture the so-called hidden workforce: those who have maximized and no longer receive unemployment benefits, those who migrated from employment to disability status and those who have exited the workforce for other reasons. So, despite a falling unemployment rate, there are still critical concerns about reengaging a notable portion of adults back in the labor force. The same holds true for the Fort Wayne area.
The regional labor force is up over this time last year (3,148) and the unemployment rate has continued to drop, a promising combination (see Table 2). Currently, there are about 207,341 adults in the Fort Wayne labor force, down about 6,000 since the same month in 2007. Recent dynamics are promising, but there is still work to do. Continuing to re-engage workers who dropped out of the labor force in the wake of the Great Recession remains a challenge, but transitioning a greater number of those active in the labor market to employment is an important sign of confidence and opportunity.
Table 2: Labor Market Dynamics, August 2012 to August 2013
| Year | Month | Fort Wayne MSA | Unemployment Rate | ||||
|---|---|---|---|---|---|---|---|
| Unemployed | Employed | Labor Force | Fort Wayne MSA | Indiana | United States | ||
| 2012 | August | 16,769 | 187,424 | 204,193 | 8.2 | 8.4 | 8.2 |
| September | 16,946 | 188,184 | 205,130 | 8.3 | 8.5 | 7.6 | |
| October | 15,538 | 188,885 | 204,423 | 7.6 | 8.4 | 7.5 | |
| November | 15,799 | 188,303 | 204,102 | 7.7 | 8.4 | 7.4 | |
| December | 16,690 | 187,655 | 204,345 | 8.2 | 8.3 | 7.6 | |
| Annual | 16,857 | 188,031 | 204,888 | 8.2 | 8.4 | 8.1 | |
| 2013 | January | 18,560 | 185,486 | 204,046 | 9.1 | 8.6 | 8.5 |
| February | 18,079 | 185,440 | 203,519 | 8.9 | 8.7 | 8.1 | |
| March | 17,669 | 183,757 | 201,426 | 8.8 | 8.7 | 7.6 | |
| April | 15,428 | 187,900 | 203,328 | 7.6 | 8.5 | 7.1 | |
| May | 15,678 | 188,749 | 204,427 | 7.7 | 8.3 | 7.3 | |
| June | 16,985 | 191,350 | 208,335 | 8.2 | 8.4 | 7.8 | |
| July | 17,614 | 188,984 | 206,598 | 8.5 | 8.4 | 7.7 | |
| August | 14,522 | 192,819 | 207,341 | 7.0 | 8.1 | 7.3 | |
| August to August 1-Year Change | -2,247 | 5,395 | 3,148 | -1.2 | -0.3 | -0.9 | |
Notes: Data are not seasonally adjusted. Due to the October federal government shutdown, the scheduled September release of state and local data was delayed and was not available at the time of publication.
Source: Bureau of Labor Statistic
Fort Wayne’s workforce continues to improve its competitive position. The number of adults with associate degrees and bachelor degrees grew at a rate outpacing the nation (see Table 3). Attainment at the middle skill levels (e.g. high school, some college and associate degree) is strong; however, the metro still has a smaller share of adults who have completed a four-year degree or graduate level program in comparison to the national data.
Table 3: Highest Educational Attainment (Among Adults Ages 25 and older), 2000 to 2011
| Highest Educational Attainment | Fort Wayne MSA | United States | ||||
|---|---|---|---|---|---|---|
| 2000 | 2011* | Change | 2000 | 2011* | Change | |
| No diploma | 14.2% | 11.0% | -3.2% | 19.6% | 14.6% | -5.0% |
| High school | 34.1% | 32.8% | -1.3% | 28.6% | 28.6% | 0.0% |
| Some college | 22.5% | 22.3% | -0.2% | 21.0% | 21.0% | 0.0% |
| Associate degree | 7.9% | 9.4% | 1.5% | 6.3% | 7.6% | 1.3% |
| Bachelor’s degree | 14.1% | 16.5% | 2.4% | 15.5% | 17.7% | 2.2% |
| Master’s or above | 7.2% | 8.0% | 0.8% | 8.9% | 10.5% | 1.6% |
*2007–2011 5-year estimate period from the American Community Survey
Note: Due to the October federal government shutdown, the scheduled release of 2012 3-year estimates was delayed and was not available at the time of publication.
Source: Census Bureau
Related to this dynamic is how the MSA’s population is growing. Between July 2011 and July 2012, the Fort Wayne MSA grew by an estimated 1,838 residents: an increase of 2,607 due to natural change, an increase of 526 due to international migration, and a decrease of 1,291 due to domestic migration. Domestic out-migration is an issue throughout the state of Indiana (see Figure 1). As a result of a natural increase (more births than deaths) and international migration, however, Fort Wayne is faring better than most Hoosier metros in terms of total population change. Efforts to solidify a positive regional image, create a more dynamic downtown Fort Wayne and engage diverse residents in leadership roles—in addition to aggressive, targeted job creation efforts—are working to stem this trend. However, as concluded by Battelle in a recent report, Indiana’s lack of high-wage knowledge-intensive jobs, compared to other states, “leads to [college graduates’] migration, and ultimately to the state’s low adult educational attainment ranking relative to the nation, despite a strong higher education pipeline.”3
Figure 1: Components of Metro Population Change, July 2011 to July 2012
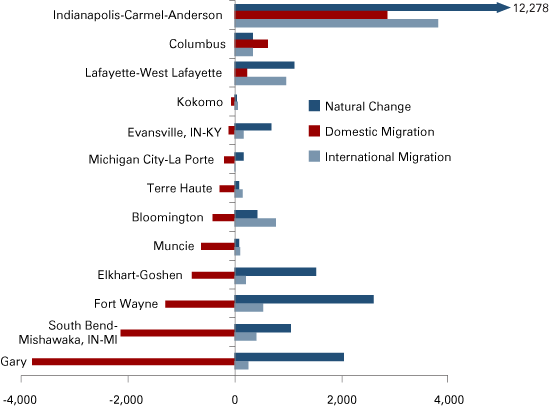
Notes: Data are sorted by domestic migration. All metros are Indiana-specific unless otherwise noted. This chart is zoomed in to better show values. The Indianapolis-Carmel-Anderson Metro’s natural increase extends beyond this chart, adding 12,278 people.
Source: Census Bureau
The Year Ahead
Each February, the Bureau of Labor Statistics releases revisions to its monthly Current Employment Statistics jobs estimates through a process known as benchmarking. Revisions to 2012 employment estimates for the Fort Wayne MSA (Allen, Wells and Whitley counties) downgraded growth, prolonging full job recovery from the recession. Across all metro areas, the average revision was 0.4 percent.4 In Fort Wayne the revision was 4.6 percent, off by 10,000 jobs.
While August’s monthly employment figures are rosy (compared to 2012), we will take them with a grain of salt until they are finalized. Based on Indiana Business Research Center estimates, EMSI projections and Community Research Institute analysis, we estimate about 1 percent growth in employment for the Fort Wayne MSA in 2014. There are, as always, a multitude of factors that could sway the MSA’s performance, and many are at the federal level. Issues of great importance to businesses and consumer confidence include the Affordable Care Act implementation, impacts of sequestration on the region’s defense communications cluster, interest rates and debt ceiling negotiations.
Notes
- U.S. Bureau of Labor Statistics Current Employment Statistics, not seasonally adjusted, September 2013. (Based on annual estimates).
- Burtless, Gary, “Unemployment Ticks down but Not All Good News: 2.4 Million Are Missing from the Labor Force,” The Brookings Institution, October 22, 2013.
- Battelle Technology Partnership, “Indiana’s Competitive Economic Advantage: The Opportunity to Win the Global Competition for College Educated Talent,” 2012.
- Brendan Hadder, Patrick Hoskins, and Daniel Stemp, “Revisions in State Establishment-based Employment Estimates Effective January 2013,” U.S. Bureau of Labor Statistics, February 2013, www.bls.gov/sae/benchmark2013.pdf.
Also in this Issue…
- International Outlook for 2014
- U.S. Outlook for 2014
- Financial Outlook for 2014
- Housing Outlook for 2014
- Indiana's Outlook for 2014
- Indiana's Agricultural Outlook for 2014
- Seeking Escape Velocity—Job, Income and Productivity Forecasts
- Anderson Forecast 2014
- Bloomington Forecast 2014
- Columbus Forecast 2014
- Evansville Forecast 2014
- Fort Wayne Forecast 2014
- Gary Forecast 2014
- Indianapolis-Carmel Forecast 2014
- Lafayette Forecast 2014
- Louisville Forecast 2014
- Muncie Forecast 2014
- Richmond Forecast 2014
- South Bend and Elkhart Forecast 2014
- Terre Haute Forecast 2014