State Revenue Collection through the Great Recession
Assistant Professor of Sociology, University of North Texas
The Great Recession of 2008 caused a major blow to the economic health of state and local governments across the United States—many of which lost substantial amounts of revenue and incurred additional debt to compensate for the lack of income and spending by their residents and companies. Some states are at least better able than others to collect general revenue from their own sources—through taxes and charges—to mitigate the effect of their broader deficits. Collecting funds from utilities is also another way states gain revenue, as well as insurance trust revenue, particularly for state employee retirement. Beyond revenue from their own sources, some states also rely on support from the federal government.
This article looks at all forms of revenue collected by state governments (including their local municipalities) but pays particular attention to general revenue from in-state sources.
Tax strategies among the states vary widely on the extent to which they collect funds from individual or corporate income taxes, general or focused sales taxes, or from property taxes at the local level. The strategies are often labeled “progressive” or “pro-business” by the burden they place on low-income workers relative to high-income workers and corporations. States also vary on the extent to which they charge fees for public services like education, medical care and highways—as well as for sewerage and the use of natural resources. Understanding the unique income patterns of states can inform the debate on how states can balance their revenue strategies for stable funding of services to avoid the risks of income shortfalls and debt during recessionary cycles.
In this article, state and local government revenue collection patterns are examined across the 50 states and the District of Columbia between 2005 and 2010 to take a preliminary look at what strategies may have allowed states to maintain revenue growth from their own sources. Data for the five fiscal years ending between 2006 and 2010 comes from the U.S. Census Bureau’s Annual Surveys of State and Local Government Finances, which prepares more than 200 estimates of federal, state and local revenue sources—as well as expenditure, cash and debt—for every state.
Overall Revenue Including Utilities and Insurance Trusts
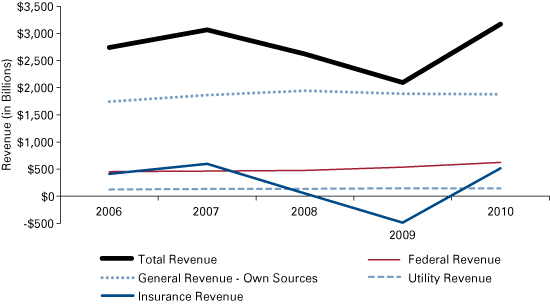
How badly did state revenue collection suffer through the economic recession? Figure 1 shows that states lost a staggering 31.7 percent of total revenue (nominal dollars) between the 2006-2007 fiscal year and the 2008-2009 fiscal year. However, Figure 1 also shows that the primary driver for such a decline is the fact that state governments borrowed extensively to obtain insurance revenues so that this value was actually negative by $487 billion in the 2008-2009 fiscal year. To partly compensate for the large state losses in revenue, the federal government increased its support to states over this period, particularly from the 2007-2008 fiscal year when it distributed $477 billion to the distribution of $623 billion in the 2009-2010 fiscal year (a 31% increase).
Figure 1: Overall Revenue Trends by Components, State and Local Governments for Fiscal Years Ending 2006 through 2010
Note: Liquor store revenue is also included in total revenue.
Source: Author’s calculations, using data from the U.S. Census Bureau’s Annual Surveys of State and Local Government Finances
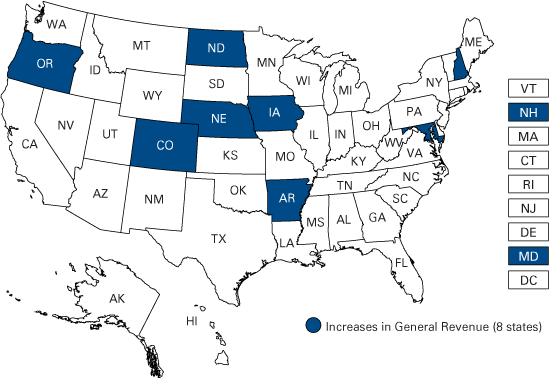
Obscured by the tremendous loss in overall revenues is the fact that states did not lose as much general revenue from their own sources such as taxes and charges. These had a relatively smaller decline from $1.94 trillion in the 2007-2008 fiscal year to $1.88 trillion by the 2009-2010 period (see Figure 1). In fact, eight states—Arkansas, Colorado, Iowa, Maryland, Nebraska, New Hampshire, North Dakota and Oregon—actually increased income from their own sources during this tough economic period (see Figure 2).
Figure 2: States with Increases in General Revenue (Taxes and Charges from State Sources) between the 2005-2006 and 2009-2010 Fiscal Years
Source: Author’s calculations, using data from the U.S. Census Bureau’s Annual Surveys of State and Local Government Finances
General Revenue Collection: Taxes and Charges
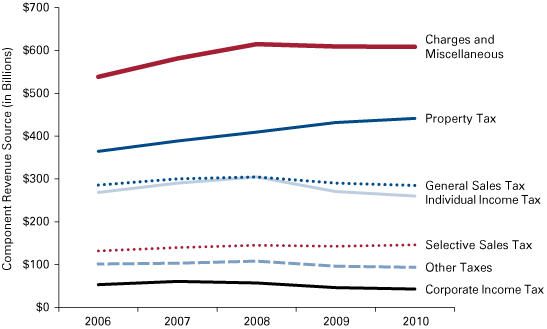
The ability of some states to maintain growth in general revenue from in-state sources has a lot to do with their strategies for obtaining revenue from their residents and visitors. The biggest component of revenue comes from charges for services they provide including education, hospitals, highways, sewerage and solid waste management. On average, these charges amounted to approximately 31.7 percent of general revenue during the 2005-2010 period. However, Figure 3 shows that during the recession, states’ revenue from charges, stayed fairly constant at just over $600 billion for the three straight fiscal years ending 2008 through 2010.
Figure 3: General Revenue Trends by Component for Fiscal Years Ending 2006 through 2010
Note: The charges and miscellaneous category includes current charges such as education, hospitals and sewerage, as well as interest earnings.
Source: Author’s calculations, using data from the U.S. Census Bureau’s Annual Surveys of State and Local Government Finances
The second most popular form of revenue collection for state governments are property taxes usually levied through local municipalities. Unlike charges, this form of revenue became increasingly lucrative despite the recession, increasing throughout this period at roughly $21 billion each year through 2008-2009 and an additional $10 billion during the fifth year.
Virtually tying as the third and fourth most popular revenue sources for state governments are general sales taxes and individual income taxes. These forms of revenue had similar fates before and after the 2008 recession, each growing to approximately $300 billion by the end of the 2007-2008 fiscal year before revenue from general sales tax declined to $285 billion and revenue from individual income tax declined to $260 billion by 2009-2010.
Other internal sources for state funding were mostly level during this five-year period. These include selective sales taxes on specific products like motor fuel, alcohol and tobacco or public utilities which stayed at approximately $141 billion. States also charged roughly $100 billion per year for a variety of “other taxes” which include estate taxes (death and gift taxes), documentary and stock transfer taxes, and severance taxes for the removal of natural resources like oil, timber and fish. Finally, corporate income taxes were collected at roughly $50 billion per year during this period.
State Strategies in General Revenue Collection
We can categorize the 50 states and the District of Columbia into four groups that summarize important differences in their general revenue collection strategies between the 2005-2006 and 2009-2010 fiscal years (see Table 1).
Table 1: Summary of State General Revenue Collection Strategies from In-State Sources, Average Percentages by Revenue Components, 2005 to 2010
| Revenue Strategy | Number of States | Property Tax | General Sales Tax | Selected Sales Tax | Individual Income Tax | Corporate Income Tax | Other Tax | Charges |
|---|---|---|---|---|---|---|---|---|
| No Individual Income Tax | 8 | 20.4 | 21.0 | 8.5 | 0.1 | 1.8 | 11.6 | 36.7 |
| No General Sales Tax | 4 | 23.9 | 0.0 | 8.6 | 14.4 | 4.2 | 11.2 | 37.6 |
| Balanced–Higher Charges | 18 | 16.6 | 16.9 | 7.5 | 13.9 | 2.3 | 6.0 | 36.8 |
| Balanced–Lower Charges | 21 | 23.2 | 14.7 | 7.9 | 18.7 | 2.8 | 4.4 | 28.2 |
| U.S. Average | 21.8 | 15.7 | 7.6 | 15.0 | 2.8 | 5.4 | 31.7 | |
Notes: These data include the District of Columbia. Figures highlighted in red are significantly different from the U.S. average (p<.05). A negligible proportion of individual tax is included for the no-income-tax states due to the small amount collected by Tennessee for interest from bonds, as well as notes and dividends from stock. “Other tax” includes motor vehicle licensing. Charges include fees for education, hospitals and other miscellaneous revenue.
Source: Author’s calculations, using data from the U.S. Census Bureau’s Annual Surveys of State and Local Government Finances
Tax strategies that minimize income tax contributions in favor of sales taxes are typically favored as pro-business or denigrated as regressive. Proponents argue that states with little or no income taxes attract high-wage workers to become residents and create business climates that encourage companies to stay or relocate into the state.1 On the other side of this debate are anti-inequality advocates who point out that low-income residents typically face a much higher tax burden in a sales-tax driven system since they must spend a far larger proportion of their wages for living expenses than wealthier residents.2
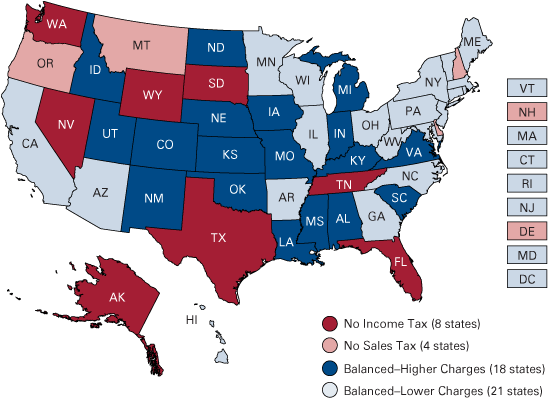
Eight states exemplify the no-income-tax approach and are displayed in Figure 4.3 These states also tend to charge relatively little or no corporate income taxes—only an average of 1.8 percent of general in-state revenue. Instead these government bodies rely on other taxes, notably high proportions of general sales tax (21.0 percent), as well as relatively high charges for services and state resources (36.7 percent) and the wide range of other taxes that include estate and severance taxes (11.6 percent).
Figure 4: Overall Revenue Trends by Components for Fiscal Years Ending 2006 through 2010
Source: Author’s calculations, using data from the U.S. Census Bureau’s Annual Surveys of State and Local Government Finances
Despite considerable debate, the no-general-sales-tax approach is generally regarded as less business-friendly and more progressive in terms of the relatively higher burden on higher-income residents and corporations compared to lower-income workers. Anti-inequality advocates would caution that even though this approach is likely to favor income taxes on wealthier groups, some states may impose flat income tax rates instead of progressive schemes that have higher rates at higher income brackets. While business leaders may be concerned at the higher income taxes that could result from a lack of sales taxes, they may applaud the possibility that retail businesses in states without a sales tax may benefit from lower effective prices and thus higher spending from local residents—and possibly residents of nearby states attempting to avoid sales taxes.
The second group of four states displayed in Figure 4—Delaware, New Hampshire, Montana and Oregon—do not collect a general sales taxes (only selective sales taxes) and to compensate seem to procure relatively high proportions of their revenue from charges (37.6 percent), other taxes (11.2 percent) and corporate income taxes (4.2 percent).
Avoiding the extreme tax collection strategies are the majority of states which make use of both general sales taxes and individual income taxes. However, these “balanced” states can still be divided based on their reliance on charges. Indiana is among the 18 states that rely on charges more than any other major form of general revenue from in-state sources. They are also distinguished by having the lowest reliance on property taxes of any other revenue collection system (only 16.6 percent), as well as relatively low individual income taxes (13.9 percent) and corporate income taxes (2.3 percent).
The other balanced revenue strategy is used by 20 states and the District of Columbia and makes use of all major forms of general revenue from in-state sources, but charges never amount to more than one-third of the total (only an average of 28.2 percent). The trade-off is that this scheme tends to rely on property taxes (23.2 percent) and individual income taxes (18.7 percent) more than any other strategy.
Impact of Revenue Collection Strategies on General Revenue
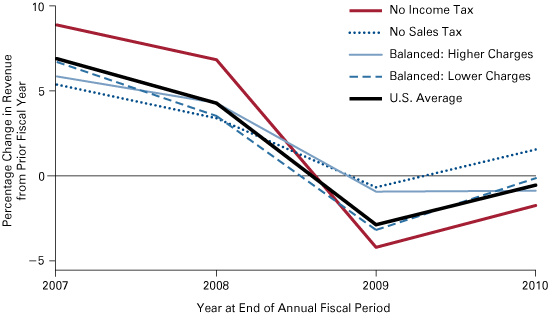
Now that we can appreciate the variety of revenue collection strategies used by state governments, what consequences might these have for their ability to obtain steady income from their in-state sources? Figure 5 illustrates annual percentage changes in general revenue at the end of the fiscal years leading into the Great Recession—2007 and 2008—as well as the fiscal years following the recession—2009 and 2010.
Figure 5: Annual Percentage Change in General Revenue from In-State Sources by State Revenue Collection Strategy for Fiscal Years Ending 2007 through 2010
Source: Author’s calculations, using data from the U.S. Census Bureau’s Annual Surveys of State and Local Government Finances
Heading into the recession, states on average experienced high revenue growth of 6.9 percent between fiscal years 2006 and 2007, followed by a strong 4.3 percent growth between fiscal years 2007 and 2008. Notable among the different revenue collection strategies are the eight no-income-tax states that experienced the highest growth in revenue during these two periods with an impressive 8.9 percent increase in revenue between 2006 and 2007, and again a strong growth rate of 6.8 percent between 2007 and 2008.
Regression estimates in Table 2 suggest that compared to the most popular revenue strategy among states (the balanced approach with low charges), the no-sales-tax states had 6.1 percentage points higher general revenue growth across this two-year period.
Table 2: Impact of Revenue Strategy on Percentage Annual Growth in General Revenue from In-State Sources over Prior Fiscal Year, 2007 to 2010, Random Effects Regression Estimates
| 2007 and 2008 | 2009 and 2010 | |
|---|---|---|
| No Income Tax -Compared to Balanced-Lower Charges |
6.070** (3.04) |
-2.823* (2.35) |
| No Sales Tax -Compared to Balanced-Lower Charge |
0.161 (0.06) |
1.544 (0.98 |
| Balanced-Higher Charges -Compared to Balanced-Lower Charges |
1.082 (0.70) |
0.499 (0.54) |
| FY 2007 -Compared to Fiscal Year 2008 |
1.690+ (1.77) |
|
| FY 2009 -Compared to Fiscal Year 2010 |
-1.470* (2.30) |
|
| Constant | 4.132** (3.59) |
-0.514 (0.73) |
| Observations | 102 | 102 |
| R-squared | 0.14 | 0.14 |
t statistics in parentheses
+ significant at 10% * significant at 5% ** significant at 1%
Source: Author’s calculations, using data from the U.S. Census Bureau’s Annual Surveys of State and Local Government Finances
However, Figure 5 also shows that states saw their revenue collection rates decline substantially by 2.9 percent in 2009 and remain flat through 2010. The states with the most precipitous decline in revenue were the no-income-tax states, which moved from having the highest average growth rate in 2008 to having the worst declines in 2009 and 2010 with decreases of 4.2 percent and 1.7 percent, respectively. States with other revenue collection strategies were notably less volatile—particularly the no-sales-tax states which experienced a relatively modest decline of 0.7 percent in 2009 and then were the only group of states that experienced revenue gains from internal sources (1.6 percent) in 2010.
Regression estimates in Table 2 confirm the decline in general revenue for the no-income-tax states is 2.8 percentage points lower than the states with the balanced lower charges approach.
In conclusion, this study reveals consequences for revenue that may come as a result of the strategies that states employ to harness income from their own sources. While there may be political and philosophical motivations behind varying tax strategies—notably the decision to use or not use individual income taxes and general sales taxes—states that levy individual income taxes appear to have had the most stability in general revenue from in-state sources between the 2006 and 2010 fiscal years.
Notes
- A thorough review of the pro-business argument that supports a lack of income taxes is included within the “2013 State Business Tax Climate Index” report available at http://taxfoundation.org/article/2013-state-business-tax-climate-index.
- This argument about regressive tax structures is well summarized by the Institute on Taxation & Economic Policy in their report “Who Pays? A Distributional Analysis of the Tax Systems in All 50 States,” available at www.itep.org/whopays/.
- Tennessee is included here among states that do not charge income tax since it only charges a relatively small tax on interest from bonds, as well as notes and dividends from stock, according to the State of Tennessee Department of Revenue.


