South Bend and Elkhart Area Forecast 2013
Director, Bureau of Business and Economic Research, Chair and Professor of Economics, Judd Leighton School of Business and Economics, Indiana University South Bend
The Michiana regional economy, which includes the South Bend-Mishawaka Metropolitan Statistical Area (MSA) and the Elkhart-Goshen MSA, continues its recovery from the setbacks from the 2007-2009 recession. We expect the region’s economic growth to continue well into 2013.
Metropolitan Gross Domestic Product
From its combined real gross domestic product (RGDP) of $19.45 billion (in chained 2001 dollars) in 2010, the region’s economy expanded thanks to the strong recovery in the Elkhart MSA’s durable goods- producing manufacturing sector. After declining 15.3 percent in 2009, its growth continues to improve—reaching 13 percent growth in 2010 and later.
The South Bend-Mishawaka metropolitan area’s RGDP grew 1.0 percent in 2010 after declining 6.9 percent in 2009, according to Bureau of Economic Analysis data. Overall, the size of the local metropolitan economies, while higher in 2012 than in 2009, has remained below pre-recession levels.
Labor Force and Employment
The decline in the labor force of the local economy has abated. The combined labor force of the two metros fell by 836 workers between September 2011 and September 2012, compared to a decline of 1,494 workers between September 2010 and September 2011. This improvement is unevenly distributed between the two metropolitan areas. From September 2011 to September 2012, the South Bend-Mishawaka MSA labor force declined by 2 percent (2,711 workers), while the Elkhart-Goshen MSA labor force added 2 percent (1,875 workers).
Combined employment for both metros rose by 8,800 from 243,800 jobs in September 2011 to 252,600 in September 2012. The Elkhart-Goshen MSA added 8,600 of those jobs, while the South Bend-Mishawaka MSA added the other 200 jobs. During the same period, the number of unemployed dropped 25 percent (2,581) in the Elkhart-Goshen area, and 18 percent (2,703) in the South Bend-Mishawaka MSA.
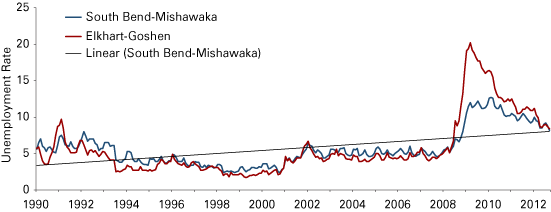
As a result, the unemployment rate fell sharply in both MSAs between September 2011 and September 2012—3 full percentage points in Elkhart-Goshen and 1.6 percentage points in South Bend-Mishawaka. Figure 1 presents monthly unemployment rates from 1990 to 2012. These rates were lower by the third quarter of 2012 than they were in 2009 and 2010.
Figure 1: Unemployment Rates in the Elkhart-Goshen and South Bend-Mishawaka MSAs, January 1990 to September 2012

Source: STATS Indiana, using Bureau of Labor Statistics data
The recovery that began in June 2009 spurred economic growth, a reduction in the number of unemployed and a decline in unemployment rates across the two metro areas. By the third quarter of 2012, the Elkhart-Goshen MSA saw its unemployment rate fall 11.8 percentage points from its March 2009 peak of 20.2 percent. Similarly, the South Bend-Mishawaka MSA’s unemployment rate fell from its peak of 12.7 percent reached in February 2010 to 8.2 percent by the end of the third quarter 2012.
Table 1 shows the metropolitan areas’ employment data by industry. After losing a staggering number of jobs during the 2007-2009 recession, the combined MSAs employed 252,600 workers in the nonfarm sectors in September 2012. South Bend-Mishawaka MSA’s employment was 19,800 workers higher than Elkhart-Goshen.
Table 1: Employment by Industry and Metro Area, September 2012
| Industry | Elkhart-Goshen | South Bend-Mishawaka | Combined Region | ||||
|---|---|---|---|---|---|---|---|
| Employment | Change since September 2011 | Employment | Change since September 2011 | Employment | Change since September 2007 | Change since September 2011 | |
| Total Nonfarm | 116,400 | 8,600 | 136,200 | 200 | 252,600 | -24,500 | 8,800 |
| Natural Resources, Mining and Construction | 3,600 | 400 | 4,800 | 100 | 8,400 | -2,700 | 500 |
| Manufacturing | 53,400 | 6,600 | 17,900 | 500 | 71,300 | -11,000 | 7,100 |
| Trade, Transportation and Utilities | 16,900 | 200 | 24,800 | 500 | 41,700 | -5,300 | 700 |
| Information | 600 | 0 | 1,500 | 0 | 2,100 | -800 | 0 |
| Financial Activities | 2,900 | -100 | 5,600 | -100 | 8,500 | -1,700 | -200 |
| Professional and Business Services | 9,000 | 1,000 | 13,200 | 100 | 22,200 | -1,100 | 1,100 |
| Private Educational and Health Services | 10,800 | 0 | 35,000 | -100 | 45,800 | 1,700 | -100 |
| Leisure and Hospitality | 7,000 | 100 | 13,100 | 500 | 20,100 | -100 | 600 |
| Other Services | 3,300 | -100 | 5,500 | 0 | 8,800 | -1,000 | -100 |
| Government (Includes Public Schools and Hospitals) | 8,900 | 500 | 14,800 | -1,300 | 23,700 | -2,500 | -800 |
Source: STATS Indiana, using Current Employment Statistics data
While jobs in the two metropolitan areas were down 24,500 from where they were in September 2007, according to Bureau of Labor Statistics (BLS) data, third quarter 2012 employment data indicate solid job gains for the local economy. For example, the combined total nonfarm jobs were up 8,800 from 2011 levels. In the most recent data, five industries added jobs, four industries suffered job losses and one industry saw no change in employment. Industries adding jobs include natural resources, mining, and construction; manufacturing; trade, transportation and utilities; professional and business services; and leisure and hospitality. Industries that recorded job losses include financial activities; private educational and health services; other services; and government. Employment in the information activities sector remained flat.
The Elkhart-Goshen MSA added 400 new jobs in natural resources, mining and construction; 6,600 jobs in manufacturing; 200 jobs in trade, transportation and utilities; 1,000 jobs in professional and business services; 100 jobs in leisure and hospitality; 500 jobs in government; and 100 job losses in other services.
The South Bend-Mishawaka MSA added 100 jobs in natural resources, mining and construction; 500 jobs in manufacturing; 500 jobs in trade, transportation and utilities; 500 jobs in leisure and hospitality; and 100 jobs in professional services. All the 100 job losses in private educational and health services and the 1,300 job losses in government services were in the South Bend-Mishawaka MSA.
Both MSAs share the combined financial activities job losses equally, with 100 job losses in the South Bend-Mishawaka MSA, and 100 job losses in the Elkhart-Goshen MSA.
We forecast overall employment gains of 1.2 percent for the South Bend-Mishawaka MSA and 2 percent for the Elkhart-Goshen MSA during the fourth quarter of 2012 and in 2013.
Local Wages and Hours Worked
Average weekly wages in the combined MSAs increased steadily since 2009, according to BLS data. Average weekly wages rose at a 3 percent annual rate to $751 in the Elkhart-Goshen MSA, compared to a 2 percent annual rate rise in the South Bend-Mishawaka MSA to $748 by the first quarter of 2012. Similar to average weekly wages, average weekly hours expanded gradually since January 2011. In addition, by September 2012, the Elkhart-Goshen MSA’s average weekly hours jumped 10 percent to 37.4 hours from the index’s low of 33.9 hours recorded in December 2008. Similarly, the South Bend-Mishawaka MSA’s average weekly hours climbed 4 percent from 34 hours (April 2009) to 35.5 hours (September 2012). We forecast that these trends in wages and hours will continue as the local economy continues its modest recovery.
Housing
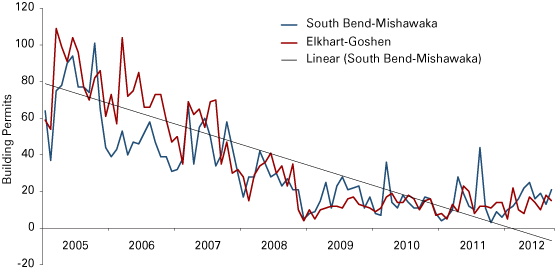
By 2011, the two metropolitan areas saw a housing sector recovery. Recent housing market indicators remained positive during the first three quarters of 2012. The number of single-family housing permits in both MSAs showed moderate improvement. From January 2012 to September 2012, the Elkhart-Goshen MSA had 119 single-family building permits filed. This number is 8.2 percent higher than the 110 recorded during the first nine months of 2011 (see Figure 2). During the first nine months of 2012, South Bend-Mishawaka’s number of single-family building permits filed was 6.9 percent higher than its 144 total during the same period in 2011.
Figure 2: Single-Family Residential Building Permits by Metropolitan Area, January 2005 to September 2012

Source: U.S. Census Bureau
Current data provided by the Indiana Association of Realtors indicate improvement in local housing markets. Inventory of homes for sale fell 15.6 percent while closed sales jumped 10.3 percent in Elkhart-Goshen. During the same period, the inventory of homes for sale fell 14.3 percent while closed sales climbed 7.9 percent in South Bend-Mishawaka. In addition, median home prices jumped 5.9 percent from $92,500 in September 2011 to $98,000 in September 2012 in the Elkhart-Goshen MSA, while declining 2.8 percent from $106,000 to $103,000 during the same period in South Bend-Mishawaka. We expect the continuation of moderate growth in the local housing markets.
Summary
Recent economic indicators indicate the local economy has improved since the 2007-2009 recession that resulted in significant job losses, high unemployment rates, falling real wages and weak housing markets. Beginning in 2011, the two MSAs have witnessed modest job growth, a significant decline in the jobless rates, and rising average weekly wages and hours. We are guardedly optimistic about the outlook for 2013, expecting employment gains of 1.2 percent in the South Bend-Mishawaka MSA and 2 percent in the Elkhart-Goshen MSA.
Looking ahead, we are beginning to see some increased business growth and expansions, including Utilimaster, ACC Climate Control Inc., Champagne Metals LLC, Colbert Packaging, Custom Wood Product Inc., LOOK Founders and Supreme Industries in the Elkhart-Goshen MSA. The same is happening in the South-Mishawaka MSA where new start-up firms, Data Realty and F Cubed, expanded to new locations from the Innovation Park in South Bend.
Both MSAs have established strong and effective private-public partnerships to accelerate growth in the region. The Corporate Partnership for Economic Growth (CPEG) was formed to support entrepreneurship in four counties in the region. The Economic Development Corporation of Elkhart County established a task force to promote entrepreneurship, innovation and diversification of the Elkhart-Goshen economy. With these growth initiatives, we expect the Michiana region’s economic activity to pick up, wages to rise and unemployment rates to fall below current levels.
References
- Bureau of Economic Analysis: www.bea.gov/iTable/iTable.cfm?reqid=70&step=1.
- STATS Indiana Covered Employment and Wages: www.stats.indiana.edu/cew/.
- STATS Indiana Labor Force Estimates Time Series View: www.stats.indiana.edu/laus/laus_view3.html.
- STATS Indiana Current Employment Statistics: www.stats.indiana.edu/ces/ces_naics/.
- Indiana Association of Realtors® Indiana Housing Market Update: www.10kresearch.com/reports/IAR/Main.htm.
Also in this Issue…
- International Outlook for 2013
- U.S. Outlook for 2013
- Financial Outlook for 2013
- Indiana's Outlook for 2012
- Indiana's Agricultural Outlook for 2013
- Three Key Indicators—Forecasts for Jobs, Income and Productivity
- Anderson Forecast 2013
- Bloomington Forecast 2013
- Columbus Forecast 2013
- Evansville Forecast 2013
- Fort Wayne Forecast 2013
- Gary Forecast 2013
- Indianapolis-Carmel Forecast 2013
- Lafayette Forecast 2013
- Louisville Forecast 2013
- Muncie Forecast 2013
- Richmond Forecast 2013
- South Bend and Elkhart Area Forecast 2013
- Terre Haute Forecast 2013


