Evansville Forecast 2013
Professor of Economics and Dean of Business, College of Business, University of Southern Indiana
Economic performance in 2012 highlights the complexity of making accurate forecasts even for relatively short time horizons. Errors in predicting turning points for key influences on economic activity such as business sentiment and personal consumption expenditures are critical illustrations of the complex forces that impact forecasting accuracy. Even as the national economy maintained an upward trajectory in output and employment during 2012, there have been noticeable changes in direction in consumer confidence, personal consumption expenditures and business investment between the first and third quarters of 2012.
By the end of 2011, the economic recovery that started in mid-2009 exhibited distinctive features when compared to previous post-World War II economic recoveries. The current recovery is taking longer to attain pre-recession levels of employment and output, and is characterized by mixed signals on its intensity and momentum. These characteristics raise fundamental questions about the relative roles of structural change and cyclical fluctuations in explaining the characteristics of the current recovery.
An examination of the Evansville economy during 2012 indicates some improvement in the labor market but an unexpected decline in real output. Increases in personal income and real retail sales that were evident in 2011 continued in 2012 but at much slower rates. In 2012, nominal personal income saw an estimated 3.0 percent increase and real gross metro product decreased by an estimated 1.6 percent. These updated estimates are below forecasts of 4.7 percent and 3.0 percent, respectively, that were made at the end of 2011 and reflect the impact of business closures in the local economy.
The unemployment rate fell from 8.3 percent in January 2011 to 6.7 percent in September 2012, compared with a drop in the national unemployment rate from 9.8 percent to 7.8 percent over the same time period. Job gains occurred in the following sectors: arts, entertainment, and recreation; transportation and warehousing; health care and social assistance; and utilities. Activities experiencing jobs losses include retail trade, construction, manufacturing, mining and financial services.
Mixed signals are also evident in the housing market. Homeowners experienced some home price depreciation as existing-home prices decreased from an average of $92,600 in 2011 to $92,100 in the first quarter of 2012, and mortgage originations were estimated to increase from $808 million in 2011 to $1,006 million in 2012. Between 2011 and 2012, single-family housing permits are estimated to have increased by 26 percent, and personal bankruptcies per 1,000 persons were estimated to have decreased from 5.2 to 4.2.
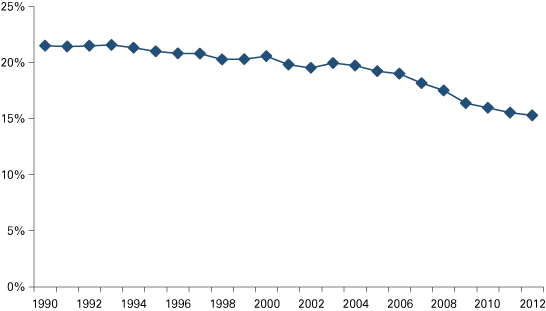
The manufacturing sector continues to be an important base to metro area household incomes and consumer spending activity even as the economy adjusts to an ongoing diversification away from manufacturing-industry dependence (see Figure 1).
Figure 1: Evansville MSA Manufacturing Employment as Percent of Total Nonfarm Employment, 1990 to September 2012

Source: STATS Indiana, using Bureau of labor Statistics data
As one of the most manufacturing-dependent metro areas in the nation, the Evansville economy was noticeably impacted since the inception of the recent recession. Since 2007, Evansville’s manufacturing workforce has fallen by 16.4 percent or about 5,300 workers, compared to the 11.1 percent reduction in Indiana’s manufacturing workforce over the same period. In 2012, manufacturing earnings continued to be a significant driver of economic activity, accounting for 23.3 percent of total earnings in the Evansville metro economy.
Given the proportion of output that is sold outside the metro area, the strength of the recovery in the Evansville area is linked to the strength of the broader economy. As the demand for locally produced goods reverts to its pre-recession level, personal income and output growth are expected to increase in 2013.
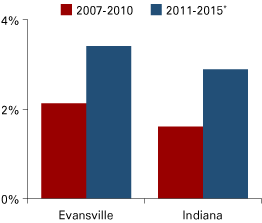
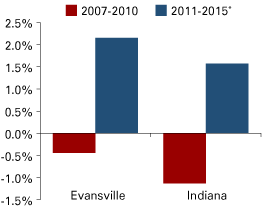
In 2013, for the Evansville metro area, output is forecasted to increase by 1.8 percent, the number of jobs is projected to increase by 600 and the forecast for nominal personal income growth is 4.1 percent. Figures 2 and 3 provide a comparison of forecasts for the Indiana segment of the Evansville economy and the state of Indiana for the 2011-2015 period.
Figure 2: Percent Change in Average Personal Income

*Includes forecasted data
Source: Center for Econometric Model Research
Figure 3: Percent Change in Average Total Employment

*Includes forecasted data
Source: Center for Econometric Model Research
While output and employment growth are projected to increase in 2013, the Evansville economy faces an ongoing challenge as a result of long-term adjustments occurring within the manufacturing sector, particularly in the share of nondurable manufacturing. Table 1 shows manufacturing as a percent of total employment for the metro, state and nation. In addition, a relatively slow growth trend in population, income and employment over the past three decades—combined with rapid change in the pace of technology adoption—highlight the importance of achieving higher rates of output and employment growth. This requires a greater focus on identifying and taking advantage of opportunities that can lead to transformational change in economic activity and the economic structure of the Evansville metro area.
Table 1: Manufacturing Percent of Total Employment, September 2012
| Industry | Evansville Metro | Indiana | U.S. |
|---|---|---|---|
| Manufacturing | 15.3% | 16.7% | 9.0% |
| Durable Goods | 52.8% | 72.6% | 62.3% |
| Nondurable Goods | 47.2% | 27.4% | 37.7% |
Note: September data are preliminary and not seasonally adjusted.
Source: STATS Indiana, using Bureau of Labor Statistics data
Also in this Issue…
- International Outlook for 2013
- U.S. Outlook for 2013
- Financial Outlook for 2013
- Indiana's Outlook for 2013
- Indiana's Agricultural Outlook for 2013
- Three Key Indicators—Forecasts for Jobs, Income and Productivity
- Anderson Forecast 2013
- Bloomington Forecast 2013
- Columbus Forecast 2013
- Evansville Forecast 2013
- Fort Wayne Forecast 2013
- Gary Forecast 2013
- Indianapolis-Carmel Forecast 2013
- Lafayette Forecast 2013
- Louisville Forecast 2013
- Muncie Forecast 2013
- Richmond Forecast 2013
- South Bend and Elkhart Area Forecast 2013
- Terre Haute Forecast 2013


