Mix of Occupations Impacts Metro Income
Director of Economic Analysis, Indiana Business Research Center, Kelley School of Business, Indiana University
Research Assistant, Indiana Business Research Center, Kelley School of Business, Indiana University
Indiana’s per capita personal income (PCPI) was 86 percent of the PCPI for the United States as a whole in 2008. PCPI in the Indianapolis metro area, on the other hand, was 98 percent of the nation. Why is the Indy area doing so much better than Indiana?
Recent IBR articles have explained Indiana’s lackluster personal income performance compared to the nation.1 This article expands on that research to show that the occupational mix in Indiana’s metro areas explain the differentials in PCPI across the state.
Figure 1 shows the share of total employment in the higher-earning occupations for Indianapolis, Indiana, and the United States. There are some striking differences. With the exception of the health care practitioner and technical occupations group, every top-tier occupation category is represented more highly in Indianapolis and the United States than in Indiana as a whole. While earnings in these top-tier occupation categories are generally higher in the nation than in Indianapolis, the metro has a similar wage and concentration advantage over the state in these higher-earning occupation categories. The extent to which Indianapolis mirrors the nation, and differs from the state, both in terms of earnings and concentration of higher-earning occupations suggests that the answer for Indiana’s PCPI problems might lie in these occupations.
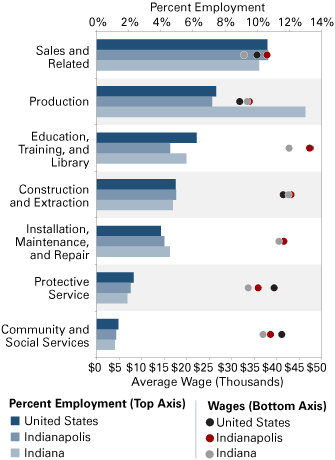
Figure 2 presents the same geographic comparison for middle-tier occupation categories. These occupations do not show nearly as uniform a pattern, but one category can be easily differentiated from the rest—production occupations. At 13 percent of Indiana employment, the concentration of production occupations in the state is almost double that in Indianapolis and the United States. The state’s average production wage is below that in Indianapolis and, as a result, the heavy concentration does not help in terms of average overall wage for the state. Again, Indy’s advantage seems to come from a concentration in higher-earning occupations.
Figure 1: Indianapolis Higher-Earning Tier Comparison, 2008
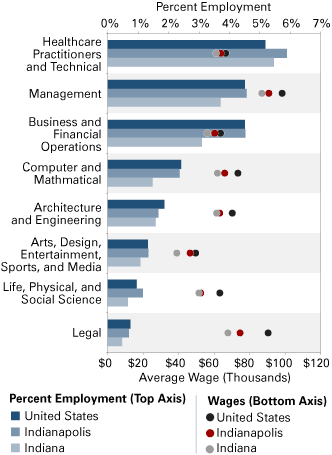
Figure 2: Indianapolis Middle-Earning Tier Comparison, 2008
Source: IBRC, using data from the Bureau of Labor Statistics data
To gain a stronger grasp of what is driving the discrepancy between PCPI across the state, consider two other metropolitan statistical areas (MSAs): Fort Wayne and Columbus. Fort Wayne’s concentration and average wage for the top-tier occupations are pictured in Figure 3, alongside those for Indiana and the United States. Fort Wayne’s PCPI is just barely below the Indiana average, 85 percent of the nation’s PCPI. Again, with the exception of the health care practitioner and technical occupations group, all top-tier occupation categories show Fort Wayne and Indiana with lower concentrations than the nation. Just as in Indianapolis, the U.S. average for wages in these occupation groups are materially greater than in Indiana and Fort Wayne. Thus, Fort Wayne and the state as a whole are at a disadvantage in terms of the concentration and the average wage of the higher-earning occupations.
Figure 4 compares the middle-tier occupations for Fort Wayne against the nation and the state. Specifically, the Fort Wayne MSA shares Indiana’s high concentration of production occupations. Unlike the top-tier occupations, there is a small discrepancy in average wage for these occupations between Fort Wayne and Indiana.
Figure 3: Fort Wayne Higher-Earning Tier Comparison, 2008
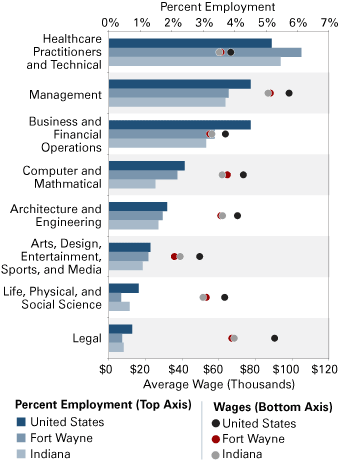
Figure 4: Fort Wayne Middle-Earning Tier Comparison, 2008

Source: IBRC, using data from the Bureau of Labor Statistics data
Columbus’ PCPI sits between Fort Wayne and Indianapolis. In 2008, it was 95 percent of U.S. PCPI, beating the state average by 9 percentage points. Figure 5 shows the higher-earning, top-tier occupations for Columbus. The story is more analogous to Indianapolis than to Fort Wayne. It is clear from Figure 5 that Columbus’ advantage derives predominantly from two occupation categories: management and engineering. The architecture and engineering category, especially, dwarfs the nation and Indiana in concentration, with an average wage slightly above the Indiana average. To put this in perspective, the concentration of architecture and engineering occupations in Columbus is more than three times the concentration in Fort Wayne. In addition, the average wage for management occupations in Columbus is well above Indiana’s average, and just slightly below the U.S. average.
Figure 6 introduces a countervailing force, which is its concentration of production jobs at more than 20 percent of total employment. Even so, the high concentration of top-tier jobs exerts great influence over Columbus’ average wage. In Columbus, the contribution to average wage from top-tier jobs is $15,577, 9.2 percent higher than the contribution for middle-tier jobs. For comparison, consider that in Fort Wayne, top-tier jobs contribute $12,348 to the average wage, 15.4 percent below the contribution from middle-tier jobs. Columbus is yet another example of how top-tier occupations can help to lift average income.
Figure 5: Columbus Higher-Earning Tier Comparison, 2008
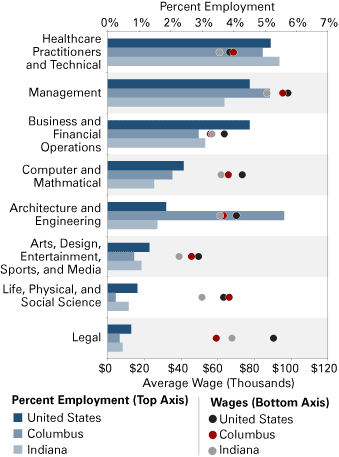
Figure 6: Columbus Middle-Earning Tier Comparison, 2008
Source: IBRC, using data from the Bureau of Labor Statistics data
In our previous article on the occupational dynamics that drive Indiana’s lagging PCPI, we concluded that the main culprit is Indiana’s relatively low concentration of higher-earning occupations and the lower earnings of those occupations. In this article, we suggest why the PCPI of Indianapolis is about the same as the nation as a whole—the occupational mix of Indy looks like the occupational mix of the nation. Comparing Columbus and Fort Wayne’s occupational mixes against the state and national averages both helps to explain their relative PCPI performance and bolsters the case that Indiana’s lackluster income performance can be explained by the relative dearth of jobs in higher-earning occupations.
Note
- See Andy Zehner, “Five Hundred Reasons Hoosier Incomes Trail the Nation,” Indiana Business Review 84, no. 3 (2009), www.ibrc.indiana.edu/ibr/2009/fall/article2.html and Timothy F. Slaper and Ryan A. Krause, “Occupational Hazard: Why Indiana’s Wages Lag the Nation” Indiana Business Review 85, no. 1 (2010), www.ibrc.indiana.edu/ibr/2010/spring/article1.html.