The Indiana Life Science Industry
Economic Research Analyst, Indiana Business Research Center, Kelley School of Business, Indiana University
Director of Economic Analysis, Indiana Business Research Center, Kelley School of Business, Indiana University
The growth of the life sciences is emblematic of Indiana’s restructuring economy. As many traditional manufacturing sectors contract, Indiana’s manufacturing base has shifted toward producing other types of goods. Life science manufacturing is an important part of that shift.
Life science–related firms employed 50,000 Hoosiers in 2007.1 At 1.7 percent of total employment, these firms represent a small yet rapidly growing segment of Indiana’s workforce. Table 1 shows payroll employment in Indiana life science industries growing nearly 3 percent annually. This average annual rate of growth is more than twice as great as the nation.
Table 1: Life Science Industry Overview
| Indiana | United States | |
| Number of Life Science Establishments | 1,652 | 62,388 |
| Manufacturing | 333 | 17,485 |
| Wholesale Trade | 1,098 | 28,538 |
| Research and Development | 221 | 16,365 |
| Life Science Employment | 50,146 | 1,637,575 |
| Manufacturing | 38,486 | 704,229 |
| Wholesale Trade | 8,227 | 400,597 |
| Research and Development | 3,433 | 532,749 |
| Life Science as a Share of Total Employment | 1.7% | 1.2% |
| Average Annual Change in Life Science Employment, 2001–2007 | 2.8% | 1.2% |
| Average Annual Change in Total Employment, 2001–2007 | 0.2% | 0.7% |
| Life Science as a Share of Total Employment Growth, 2001–2007 | 22.9% | 2.0% |
| Average Annual Life Science Wage | $81,974 | $84,992 |
| Average Annual Wage (Total Employment) | $37,447 | $44,450 |
Source: IBRC, using 2007 Bureau of Labor Statistics data
The important role that the life sciences play in the state is more evident when compared to Indiana’s employment picture overall. Payroll employment in Indiana increased by 33,000 between 2001 and 2007—a 0.2 percent average annual growth. Meanwhile, life science employment expanded by 7,600 jobs, representing 23 percent of Indiana’s total job growth over this period.
What makes Indiana’s life science industries growth so important is the high wages associated with these jobs. The annual wage of a typical life science job in Indiana was $82,000 in 2007 (the latest available data)—a mark that is more than double the average wage for all employment. Furthermore, the average wage of an Indiana life science job more closely resembles the national average than is the case for employment overall.
Life science industries, as defined in this article, consist of firms operating in three business activities: manufacturing, wholesale distribution, and research and development. Not surprisingly, given Indiana’s industrial heritage, employment in the manufacturing sector accounts for 77 percent of the life science industry total compared to 43 percent nationally (see Figure 1). Meanwhile, life science wholesale trade employment is relatively small yet growing rapidly in the state—a trend that is likely to continue given the emphasis on developing Indiana’s logistics sector.
Figure 1: Life Science Industry Employment by Business Activity
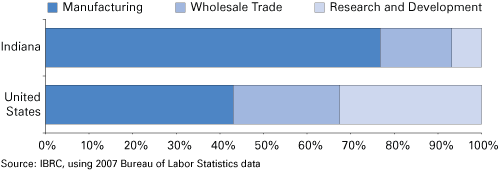
One glaring gap in Indiana’s otherwise strong life science industry is found in the research and development (R&D) sector. At the national level, a far larger share (37 percent) of the life science workforce is employed with firms focused on R&D than is the case in Indiana (7 percent). Furthermore, Indiana life science R&D wages are well below the national average. By contrast, the state’s average annual life science manufacturing wage was $81,000 compared to $78,000 for the nation. The wage differential in medical equipment wholesale trade was more than $6,000 in Indiana’s favor.
It is important to note that firms are categorized by their primary business activity for the purposes of industry classification. Primary business activity is typically defined by the pursuit that accounts for the greatest share of production costs, capital investment or revenue. Firms with a major manufacturing presence, for instance, may still heavily engage in R&D.
Life Science Manufacturing
Indiana life science manufacturing is led by pharmaceutical and medicine production (see Table 2). In 2007, this industry accounted for half of life science manufacturing employment and 38 percent of all life science jobs. With an average wage of $102,000, Indiana pharmaceutical firms pay above the national industry average and their wages are nearly three times greater than Indiana’s average for all jobs.
Table 2: Life Science Manufacturing Summary by Industry
| Manufacturing Industry | Employment | Average Wage per Job | Average Annual Employment Change, 2001-2007 | ||
| Indiana | Indiana | United States | Indiana | United States | |
| Pharmaceutical Preparation | 19,104 | $102,158 | $98,587 | 0.8% | 0.7% |
| Surgical Appliance and Supplies | 8,241 | $71,481 | $59,754 | 8.3%* | 1.2%* |
| Surgical and Medical Instrument | 8,205 | $57,574 | $66,615 | 5.4% | 0.5% |
| Dental Laboratories | 1,294 | $31,150 | $36,141 | -0.8% | 0.7% |
| Ophthalmic Goods | 608 | $27,940 | $52,023 | 4.9% | -1.9% |
| In-Vitro Diagnostic Substance | 253 | $54,352 | $90,737 | 9.3% | 5.0% |
| Analytical Laboratory Instrument | 251 | $61,813 | $83,796 | 1.8% | -0.9% |
| Dental Equipment and Supplies | 221 | $41,155 | $50,546 | 0.2% | -0.8% |
| Biological Product (except Diagnostic)** | n/a | n/a | $84,919 | n/a | 0.8% |
| Electromedical Apparatus** | n/a | n/a | $82,534 | n/a | 1.9% |
| Irradiation Apparatus** | n/a | n/a | $90,190 | n/a | 1.4% |
| Medicinal and Botanical** | n/a | n/a | $91,617 | n/a | -0.2% |
*Some North American Industry Classification System (NAICS) sectors were revised in 2007. The surgical appliance and supplies manufacturing industry received a portion of the now eliminated NAICS 339111. Therefore, a portion of this growth can be attributed to this revision.
**Indiana data are not available due to Bureau of Labor Statistics non-disclosure requirements.
Source: IBRC, using 2007 Bureau of Labor Statistics data
The manufacturing of medical instruments and surgical appliances is another area of strength. Each of these industries employed 8,200 people, which combined to account for 33 percent of Indiana’s total life science workforce. Additionally, with strong average annual growth since 2001, medical instruments (5.4 percent) and surgical appliances (8.3 percent) are high-growth industries in Indiana, far outpacing U.S. growth rates in these same sectors. Each industry had an average wage well above Indiana’s total manufacturing mark of $51,000. The surgical appliances industry, in particular, provided high wages with an average of $71,500 in 2007—nearly $12,000 above the national average.
Gains in life science manufacturing employment are in sharp contrast to the dominant trend in manufacturing overall. Indiana’s total manufacturing employment declined by nearly 66,000 between 2001 and 2007. Transportation equipment manufacturing, the state’s hallmark industry, contracted by roughly 8,000 jobs during that period.
The value of Indiana’s manufacturing output continues to climb. Current dollar output of manufacturing has grown at an average annual rate of 2.8 percent, while the production of transportation equipment specifically has increased at an annual rate of 2.2 percent (see Figure 2). The contrast of employment loss and output gain reflects several underlying forces: improvements in technology, increases in productivity and the divestment of lower value-added functions.
Figure 2: Average Annual Employment and Output Change for Select Industries, 2001–2007
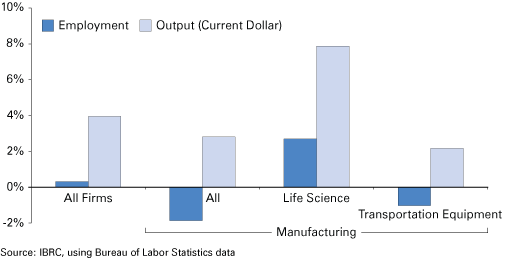
The relative strength of the state’s life science manufacturing sector is illustrated not only by employment growth but also by the nearly 8 percent average annual growth in output. This rate of growth was twice as large as the state total for all industries.
This exceptional growth in life sciences (relative to total manufacturing) signals a potential realignment of the state’s industry mix. The life science share of total manufacturing output has grown to 20 percent which, as Figure 3 illustrates, now narrowly exceeds the transportation equipment sector’s contribution.
Figure 3: Share of Indiana Total Manufacturing Output (Current Dollar) by Select Industries, 1997 to 2007
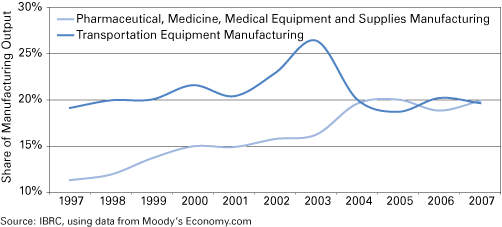
While life science manufacturing output has surpassed that of transportation manufacturing in recent years, it has done so with less than one-third the workforce. The importance of this sector’s tremendous productivity cannot be overstated. Yet it is important to keep in mind that, in terms of employment alone, gains in life science manufacturing will not offset losses in the broader manufacturing sector if recent trends continue.
Indiana Life Science Manufacturing in Perspective
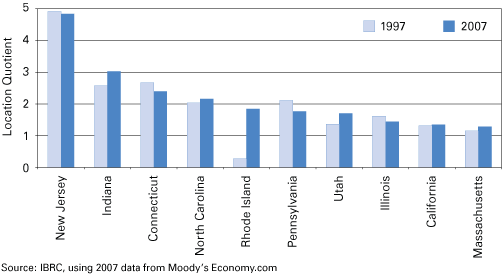
Manufacturing of pharmaceuticals and medical devices is an increasing strength of Indiana’s economy. More importantly, Indiana stands as a national leader within these key industries. For instance, Indiana firms generated $8.8 billion in pharmaceutical and medicine output in 2007 (see Figure 4). This level of output was fourth among all states behind California, New Jersey and New York—some of the nation’s largest economies. In fact, Indiana is unique in this list in that it is the only state that is not also among the top ten nationally in total output.
Figure 4: Total Output and Productivity of Pharmaceutical and Medicine Manufacturing, Leading States
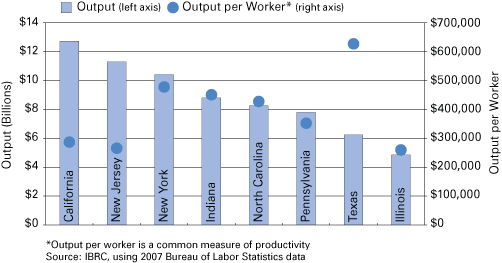
Sheer output alone does not offer a complete account of a state’s productivity given these variations in relative size of state economies. Output per worker helps to compare states on a level playing field. Indiana ranks third among these top producers in output per pharmaceutical worker at $450,000, which places the state ahead of California and New Jersey and behind only Texas and New York. Indiana’s output per worker for all industries was $82,500.
Another indication of Indiana’s position as a national leader is the relatively large share of total employment this industry holds. Indiana had a pharmaceutical employment location quotient (LQ)2 of 3.0 in 2007, meaning that the state’s share of its workforce dedicated to this sector was three times greater than that of the nation. This measure was second only to New Jersey, which had a location quotient approaching 5 (see Figure 5). Not only is Indiana highly concentrated but this concentration has increased since 1997 when its LQ was 2.6. Indiana’s ten-year change in LQ (at an annual average rate) ranked third among the leading states for this measure—behind Rhode Island and Utah.
Figure 5: Location Quotient of Pharmaceutical and Medicine Manufacturing Employment, Leading States
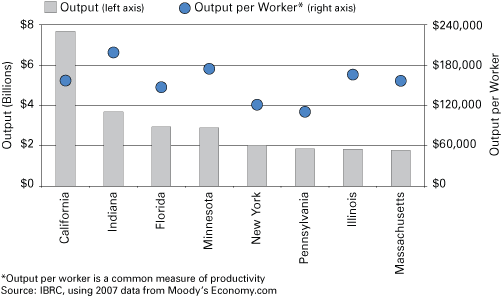
At $3.7 billion in output, the state’s medical device sector does not match the exceptional output generated by the pharmaceutical industry, yet Indiana’s position nationally is equally significant. The state ranked second in output and exhibited the highest output per medical device worker ($199,000) of these top producers. California led the nation with a total output that was more than twice as large as Indiana’s. The Hoosier State’s strong performance in this sector is especially evident when one considers that each of the states listed in Figure 6 has a larger economy than Indiana, which ranked eighteenth in total output. California’s total output, for instance, was more than seven times larger than Indiana’s.
Figure 6: Total Output and Productivity of Medical Equipment and Supplies Manufacturing, Leading States
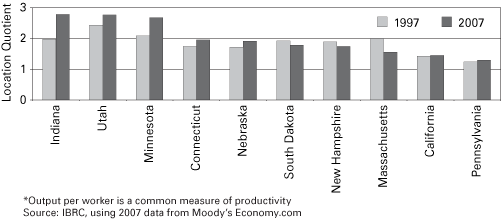
Indiana led all states in the share of employment in medical device manufacturing with an LQ of 2.8. This level was up from 2.0 in 1997, which was the largest LQ increase of the states in Figure 7.
Figure 7: Location Quotient of Medical Equipment and Supplies Manufacturing Employment, Leading States
Indiana Life Science Occupations
There is no mistaking Indiana’s position at the forefront of the nation’s life science industries. With 85 percent of employment in manufacturing-oriented firms, it stands to reason that Indiana’s life science workforce would be more heavily concentrated in production-related occupations (see Table 3). Does this mean that Indiana is simply a production hub? Or does the state support the high-skill, high-wage scientific and technical jobs commonly associated with this industry? Occupation data provide a useful supplement to industry-level trends and present a different perspective that can help answer this question.
Table 3: Life Science Manufacturing and Research and Development Jobs by Occupation Type*
| Type of Occupation | Indiana | United States |
| Production | 28.8% | 22.1% |
| Life, Physical, and Social Science** | n/a | 17.7% |
| Office and Administrative Support | 12.5% | 12.8% |
| Management | 10.7% | 9.8% |
| Architecture and Engineering | 6.1% | 9.8% |
| Computer and Mathematical | 5.5% | 7.7% |
| Business and Financial Operations | 8.1% | 6.8% |
*Only the top seven occupation types are displayed. Manufacturing jobs cover only pharmaceuticals (NAICS 3254) and medical devices (NAICS 3391).
**Indiana data are not available due to Indiana Department of Workforce Development non-disclosure requirements.
Source: IBRC, using 2007 Indiana Department of Workforce Development and Bureau of Labor Statistics data
The difference between the two perspectives—industry versus occupation—is that an establishment classified as a pharmaceutical and medicine manufacturer, for instance, employs many different types of occupations. In addition to the production workers on the shop floor, there are administrative employees that take care of payroll and billing. There are managers, quality inspectors, financial analysts and custodians. There are also chemists and biologists. All of the above occupations are integral to the operation of a successful firm, but this section focuses on occupations requiring scientific or technical skills specific to the life sciences because they provide the knowledge-based foundation for future growth.
Indiana had 8,950 people employed in life science occupations in 2007 (see Table 4).3 While this figure makes up a small share of total employment (0.31 percent), it is slightly larger than the proportion of employment these occupations hold nationally (0.29 percent). The state’s employment in nearly all life science occupations has grown since 2001.
Table 4: Summary of Indiana Life Science Occupations
| Employment | Average Annual Employment Change, 2001–2007 | Average Wage | |||
| Indiana | Indiana | United States | Indiana | United States | |
| All Occupations | 2,928,780 | 0.4% | 0.8% | $36,410 | $40,690 |
| Medical Scientists, Except Epidemiologists | 2,740§ | 47.3%§ | 10.6% | $52,710 | $74,160 |
| Biological Technicians | 1,200 | 9.5% | 7.7% | $34,960 | $40,240 |
| Environmental Scientists and Specialists, Including Health | 1,160 | 4.2% | 5.5% | $55,870 | $63,870 |
| Natural Sciences Managers | 1,130 | 0.0%*** | -1.3% | $58,590 | $113,170 |
| Microbiologists | 780* | 11.5%** | -1.0% | $67,790* | $66,430 |
| Biological Science Teachers, Postsecondary | 740 | -3.3% | 5.2% | $71,200 | $84,130 |
| Biochemists and Biophysicists | 660*§ | 27.1%**§ | 3.2% | $90,230 | $85,290 |
| Biomedical Engineers | 340* | 6.1%** | 13.2% | $62,740 | $79,610 |
| Life Scientists, All Other | 200 | n/a | n/a | $56,250 | $66,930 |
*2006 data, ** 2001-2006 data, *** 2002-2007 data
§ The Occupational Employment Statistics survey reports large margins of error in 2007 for these occupations. As a result, the reader is strongly cautioned that actual industry and employment trends may conflict with published government—Bureau of Labor Statistics—data sources. Industry experts may provide a more accurate and complete analysis of regional or state industry structure.
Source: IBRC, using 2007 Bureau of Labor Statistics
With employment of 2,740, medical scientists comprise Indiana’s largest life science occupation, growing from just 160 in 2001—a remarkable 47 percent average annual growth. Other occupations with significant growth include biochemists and biophysicists at a 27 percent annual average growth and microbiologists at 12 percent. Growth in each of these occupations outperforms national averages. Indiana’s employment trend for postsecondary biological science teachers, the only life science occupation to contract over this period, is a point of concern given the growth seen nationally and the increased emphasis that is sure to be placed on science and engineering education in the coming decades.
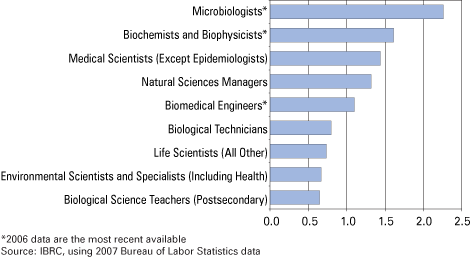
Figure 8 illustrates that Indiana had a location quotient above one in half of the life science occupations, indicating that these occupations’ shares of total employment are larger in the state than nationally. Those with the highest LQs—namely microbiologists, biochemists and biophysicists, medical scientists, and natural science managers—offer some of the top salaries among life science occupations and require the highest levels of education and preparation according to the U.S. Department of Labor’s O*NET framework. These high LQ values help to demonstrate that, although manufacturing as a business activity dominates the state’s life science pursuits, Indiana firms also employ a higher-than-average number of highly skilled scientists and technicians.
Figure 8: Indiana Location Quotients by Life Science Occupation
Conclusion
Indiana’s position as a life science leader is clear. The state is specialized in both life science industry employment and occupational employment. Perhaps more important, life science is a source of strong growth for the state at a time when other industries are facing challenges. From an employment perspective, gains in the life science industry alone will not offset job losses experienced in some of Indiana’s traditional manufacturing sectors. Continued efforts to cultivate this industry will play an important role in Indiana’s efforts to reposition its economy for the future.
For more information, view the full report online at www.ibrc.indiana.edu/studies/life-science-industries_2009.pdf.
Notes
- For the purposes of this article, the life science industry consists of establishments engaged in the research and development, manufacture, or wholesale distribution of life science products (e.g. pharmaceuticals, medical devices, etc.). Health care delivery is not included. See the full report for a detailed industry definition
(www.ibrc.indiana.edu/studies/life-science-industries_2009.pdf). - Location quotient is a measure of industry concentration which in this article calculates a ratio of an industry’s share of total employment locally to its share nationally. The national average equals 1 and an LQ above 1 indicates that a state is more specialized than the nation in that industry.
- Data for some occupations are unavailable for 2007 due to non-disclosure policies. When possible, data for previous years are used and denoted with asterisks in Table 4.


