Indiana is Different: Measuring Economic Activity in the United States and Indiana
Director Emeritus, Indiana Business Research Center, Kelley School of Business, Indiana University
The two most common measures of economic activity are output and income.
The first is most familiar to us—Gross Domestic Product (GDP). This is the number reported at least three times for each quarter of the year by the media. It measures the value of goods and services produced in the United States in a given time period. This number is available for the nation quarterly and annually and for states and metropolitan areas annually (see Table 1).
Table 1: Definitions Matter: Gross Domestic Product and Personal Income
| Gross Domestic Product | Personal Income | |
| Measures: | Values of goods and services produced in the United States | Sum of wages, salaries, bonuses, employer paid benefits, Social Security, unemployment compensation, dividends, interest, rent, and other payments to individuals |
| Availability of Data: | Nation: Quarterly and annually States and metros: Annually |
Nation: Monthly, quarterly, and annually States and metros: Quarterly and annually Counties: Annually |
The second way of assessing economic activity is through personal income. This number is reported monthly, quarterly, and annually for the nation; it is available quarterly and annually for states and metro areas, and annually only for counties. Personal income is the sum of wages, salaries, bonuses, employer paid benefits, Social Security, unemployment compensation, dividends, interest, rent, and other payments to individuals. It excludes capital gains and withdrawals from personal savings (retirement accounts) that are important to determining the spending capability of the population.
Personal income is considered one of the premier measures of economic well-being. But personal income depends primarily on the value of output (GDP). Both measures are developed and distributed by the U.S. Bureau of Economic Analysis. Here we will examine GDP for states and the nation.
Indiana in the National Perspective
In 1997, Indiana contributed 2.1 percent of the nation’s GDP and ranked as the fifteenth largest economy among the fifty states. By 2006, Indiana’s share of U.S. GDP fell to 1.9 percent—making the Hoosier state the sixteenth largest economy. This seemingly small decline of -0.2 percentage points was the ninth highest loss of GDP share in the nation.
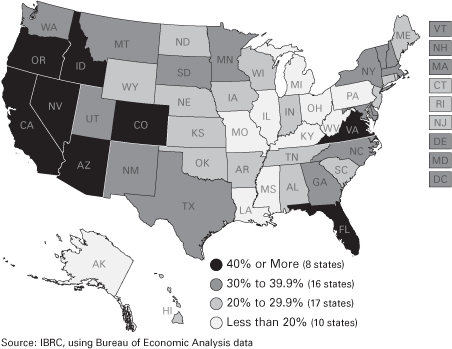
During this period, Indiana’s GDP (adjusted for inflation) grew by 21.6 percent (thirty-eighth in the nation) compared to the U.S. rate of 31 percent. Arizona led the nation at 61.8 percent and Alaska trailed all states at 4.2 percent (see Figure 1).
Figure 1: Percent Change in Total Real Gross Domestic Product, 1997 to 2006

Click for larger, more detailed image
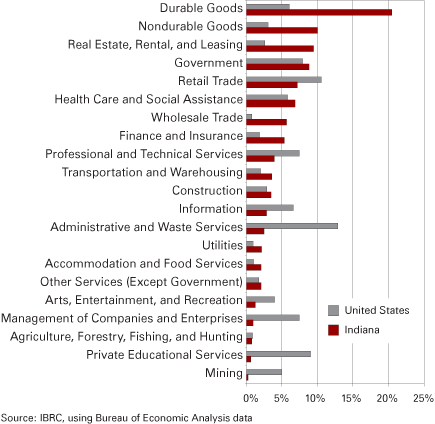
Of twenty-one sectors, Indiana’s largest was durable goods manufacturing in both 1997 and 2006. In 1997, this sector represented 18.1 percent of the state’s total GDP; this was the highest level recorded in the nation. By 2006, durable goods remained the largest portion of Indiana’s GDP at 20.5 percent, but three states had higher dependence on durable goods than Indiana (Oregon, Idaho, and New Mexico).
As seen in Figure 2, Indiana’s second largest sector in 2006 was nondurable goods manufacturing at 10 percent of the state’s GDP. Thus, manufacturing’s two sectors combined yielded 30.5 percent of the value of output in the state, higher than any other state in the union. Overall, Indiana ranked eighth among the fifty states in the amount of manufacturing generated in the United States.
Figure 2: Percent of GDP by Industry, 2006

How different is Indiana from the United States? Alternatively phrased, how much of Indiana’s output would have to be shifted among sectors to meet the national distribution? The answer is 43.5 percentage points. How did we establish that?
Look again at Figure 2. Indiana has 20.5 percent of its GDP in durable goods while the nation has 6 percent; the difference is 14.4 percentage points. Indiana has 10 percent of its GDP in nondurable goods with the United States at 3 percent; the difference, 7 percentage points. Add those two differences together and you have 21.4 percentage points, or more than half of the difference that would have to be reallocated to meet the national profile.
If you add together all of the sectors where Indiana has a higher percent of its GDP than does the nation, you will get a difference of 43.5 percentage points. Do the same with the sectors where the nation exceeds Indiana (for example, private educational services) and once again the sum will be 43.5 percentage points.
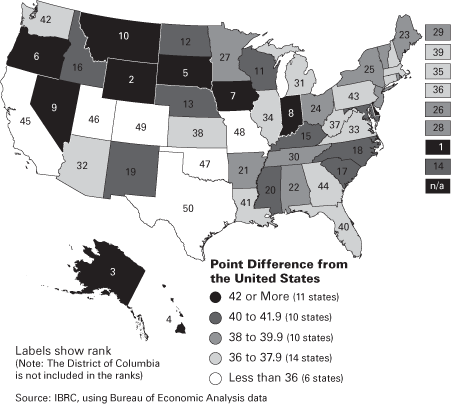
Is this a great difference or a small one? It turns out that Indiana ranks eighth in the nation in its difference from the U.S. average. Farthest from that norm is Delaware at 56 points, followed by Wyoming and Alaska. Most like the nation is Texas at 33.3 percentage points, followed by Colorado and Missouri. It is no surprise that two of the largest states (Texas and California ) are in the top six of similarity to the United States since those states have so much weight in any national data set.
It is somewhat surprising that Michigan, Illinois, Ohio, Kentucky, and Wisconsin are so much more like the nation than Indiana, which is bunched with Oregon, Iowa, Nevada, and Montana (see Figure 3).
Figure 3: Similar or Not? Measuring the Difference between State Business Activity and the U.S. Distribution, 2006

Click for larger, more detailed image
Leading Sectors
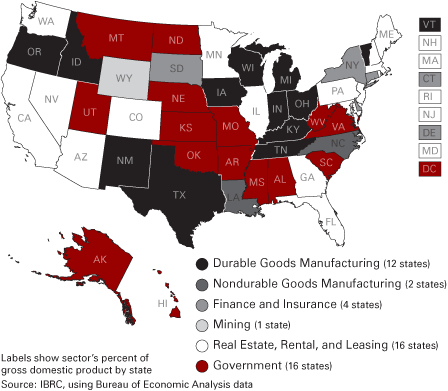
The leading sector in 2006 was Indiana’s durable goods manufacturing. That was also true in eleven other states. Leading the nation was real estate, rental, and leasing, not only for the nation as a whole, but also in sixteen states. Government was the leading sector in fifteen states. Finance and insurance was out in front in four states (Delaware, New York, Connecticut, and South Dakota). Nondurable goods manufacturing was on top in Louisiana (petroleum products) and North Carolina (textiles and apparel), as shown in Figure 4.
Figure 4: Largest Sector by State, 2006

Click for larger, more detailed image
Leading States
We would expect California and other large states to have higher percentages of each sector’s output. In that we are not disappointed.
California has the largest share of output in sixteen of twenty-one sectors (see Table 2). New York is out in front in three sectors (finance and insurance, management of companies and organizations, and private educational services). Texas claims the remaining two (mining and utilities).
Table 2: Leading States by Industry
| Sector | Largest State | Percent of U.S. GDP | Leading in State | Percent of State GDP |
| Mining | Texas | 36.9% | Wyoming | 18.2% |
| Agriculture, Forestry, Fishing, and Hunting | California | 19.9% | North Dakota | 7.0% |
| Arts, Entertainment, and Recreation | California | 17.2% | Nevada | 2.6% |
| Finance and Insurance | New York | 17.2% | Delaware | 32.0% |
| Information | California | 16.9% | Colorado | 11.4% |
| Real Estate, Rental, and Leasing | California | 16.9% | Hawaii | 17.9% |
| Professional and Technical Services | California | 16.0% | Virginia | 13.0% |
| Retail Trade | California | 13.9% | Mississippi | 10.5% |
| Durable Goods Manufacturing | California | 13.7% | Oregon | 24.7% |
| Administrative and Waste Services | California | 13.6% | Florida | 5.1% |
| Other Services (Except Government) | California | 13.1% | Utah | 2.9% |
| Accommodation and Food Services | California | 13.1% | Nevada | 14.0% |
| Wholesale Trade | California | 12.9% | North Dakota | 8.2% |
| Construction | California | 12.8% | Nevada | 8.3% |
| Private Educational Services | New York | 12.7% | Massachusetts | 2.0% |
| Utilities | Texas | 12.6% | Wyoming | 5.3% |
| Government | California | 12.3% | Hawaii | 20.4% |
| Management of Companies and Enterprises | New York | 11.8% | Delaware | 4.7% |
| Health Care and Social Assistance | California | 11.4% | Maine | 10.4% |
| Transportation and Warehousing | California | 10.7% | Alaska | 13.1% |
| Nondurable Goods Manufacturing | California | 9.4% | Louisiana | 13.5% |
Source: Bureau of Economic Analysis
It is impressive to see that California has 19.9 percent of the nation’s output in agriculture, forestry, and fisheries. However, in North Dakota, that same sector accounts for 7 percent of the state’s GDP, which is more than in any other state. Yet, as seen in Figure 4, government is North Dakota’s leading sector at 14.3 percent. We can thus say that California leads the nation in agriculture, forestry, and fisheries … but that North Dakota has a greater dependence on agriculture than any other state … but that sector is only half a large as North Dakota’s leading sector (government). Who is on first?
Note of Caution
This series of GDP for states is still young. Detailed changes over time are not easy to interpret for individual sectors and we will avoid that here. But this series will become more powerful in decision making as leaders and economic analysts gain knowledge and comfort with it.


