What Is the Economic Base of This Place?
Indiana Business Research Center, Kelley School of Business, Indiana University
What is the economic base of your county? “Manufacturing,” some will insist. Others, with equal vigor, will proclaim, “Farming.” Fortunately, both can be right if they pick their numbers selectively.
The concept of economic base is very important in the theory and practice of economic development. We think of the economic base as the engine that drives the economy of the community. It is the sector or sectors providing exports from the local area to the rest of the world.
Without an economic base, that is, without an export sector, it is presumed that a community will die, unable to survive “by taking in each others’ washing.” Growth in the export sector is seen as the route to greater income and wealth for residents of the community.
Hence, we find most communities now devoting resources to attract “export industries,” firms that will produce for people who live outside the community. This is no longer limited to “smokestack chasing,” but has evolved into a sophisticated model where economic development professionals focus on activities such as tourism, health care, retirement, and education.
Location Quotients
How do we know what is the economic base of a community? For decades, economists and economic developers have used location quotients as a quick and dirty means of identifying dominant or prominent industries in an area. It is certainly a dirty means, filled with traps.
A location quotient (LQ) is very easy to compute. Take an industry (retail trade), find out what percent of employment (or earnings) that industry represents of total employment (or earnings) in Indiana (or the nation). Then do the same for retail trade in your county. Divide the county percent by the state (or national) percent and, behold, you have a location quotient.
For example, retail trade accounted for 6.95 percent of all earnings in Indiana. Down on the Ohio River across from Louisville, retail trade equaled 9.51 percent of all earnings generated in Clark County. This yields an LQ of 1.37. In the language of LQs, this indicates that Clark County is an exporter of retail services. If you know the area, it makes sense. People from Floyd, Scott, Jefferson, Washington, Harrison, and other counties do come to Clark to do some of their shopping.
The more an LQ is above one, the greater the strength we have in our belief that this sector is an exporter for the local area. The closer the LQ drops toward zero, the more likely people in that county are importing goods or services in that sector from somewhere else.
It’s a nice measure. Not a guaranteed indicator, but one that is easy to use and easy to understand; thus, it is very popular.
Export Base and Location Quotients
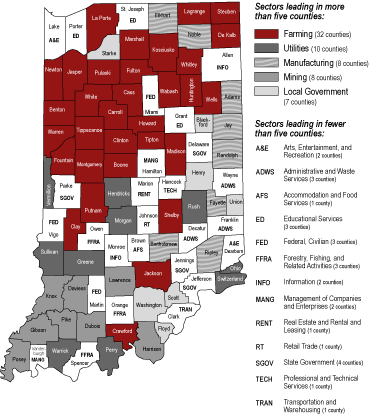
Figure 1 shows the export base for each Indiana county. Here we see that thirty-two of the state’s ninety-two counties have farming as their leading export sector. That is, the LQ for farming was the highest of any of the twenty-five sectors on which we have earnings data from the U.S. Bureau of Economic Analysis for 2002. Earnings are the payments received by persons who work for themselves or for someone else. They include salaries, wages, bonuses, and the value of benefits such as health insurance.
Figure 1
Leading Export Sectors based on Location Quotients, 2002
Click for larger image
Eighteen of our twenty-five sectors are represented in Figure 1. Some may be surprised that arts, entertainment, and recreation lead the economic base in two counties—Dearborn and Lake. But, then you think of the casinos and you understand. In Lake County, that sector represents just 4.6 percent of the earnings, but statewide the sector accounts for just 1.3 percent of all earnings. Hence, Lake County gets a big 3.5 LQ in arts, entertainment, and recreation, higher than any other sector in the county.
But what happened to manufacturing? Isn’t it a major factor in Lake and other Indiana counties? Of course, but it shows up in Figure 1 as the dominant export sector only eight times.
Alternative View: Percent of Earnings
If we look at our data differently, manufacturing clearly dominates in contributing to earnings. Statewide, manufacturing accounts for 26.4 percent of all earnings. It is the dominant sector, well ahead of number two, health care and social assistance, which comes in at 9.7 percent.
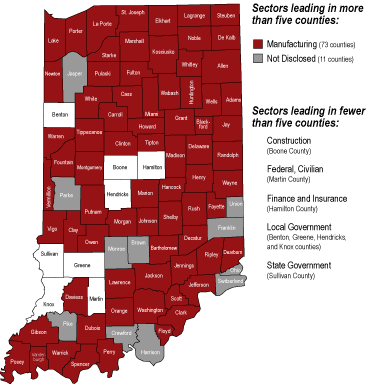
As seen in Figure 2, manufacturing dominates in seventy-three of the ninety-two counties. But there are some problems to be considered. Note that “not disclosed” is the dominant category for eleven counties. Don’t we know the dominant activity in Monroe County? Aren’t there more than thirty-thousand students, a football team, and other activities that suggest a major state university in Monroe County?
Figure 2
Leading Sectors in Percent of Earnings, 2002
Click for larger image
The Disclosure Problem
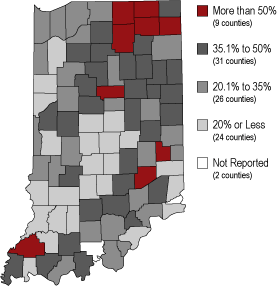
Nondisclosure distorts our data in many cases. In manufacturing, it is of little concern, occurring in just two counties (see Figure 3).
Figure 3
Percent of Earnings Derived from Manufacturing, 2002
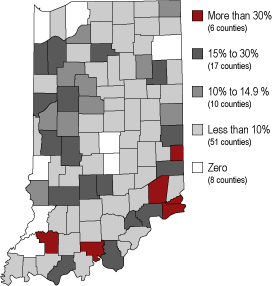
But in some counties, it represents major portions of all earnings, as seen in Figure 4. Twenty-three counties have 15 percent or more of their earnings not reported because of disclosure issues. Only eight counties are fully reported.
Figure 4
Percent of Earnings Not Reported Due to Disclosure Problems, 2002
Why are the data for state and local governments in Monroe and Tippecanoe counties
withheld? The U.S. Bureaus of Economic Analysis and Labor Statistics have established
disclosure rules designed to prevent information on a specific firm being revealed
by their data. This may be fine for the private sector, but why withhold data
for public institutions? Even the private sector rules make no sense in a world
of annual reports and complex filings with the Securities and Exchange Commission.
Much of the data withheld because of disclosure fears are in sectors and counties where there are few firms. Therefore, we find no disclosure problems in farming. But farming, because of its distinctive accounting practices, is not comparable to other industries.
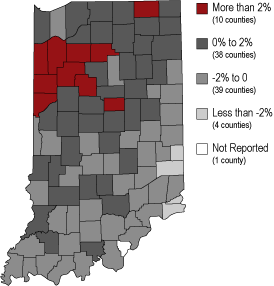
Farmers often report losses, even in good years (see Figure 5). In 2002, total farm earnings (income of farm proprietors and their workers) were negative in forty-three counties and not reported in one county. This can occur as farmers transform income to wealth by buying equipment, land, or supplies and charging depreciation or expenses against income. Most workers are not in a position to take these deductions or charges. Capital expenditures are taken by corporations in most firms and do not adversely affect the earnings data.
Figure 5
Farm Earnings as a Percent of Total Earnings, 2002
Where Does That Leave Us?
The economic base of a community may be calculated using location quotients or by considering the portion of income generated by specific sectors. The LQ relates the earnings percentage to a common base—the state or nation—but can lead to findings that suggest minor sectors, in terms of actual income, are of greater importance than reason would dictate. For example, in Figure 1, farm earnings were less than 3 percent of total earnings in thirty of the thirty-two counties shown as having farming as their leading economic base activity. Are we to believe that the economic base is a pyramid balanced on its point?
What are we to do with such a conundrum? When one number won’t do the job, try two. This may sound cynical, but it is what we do in most cases. We do not rely on temperature alone to tell us how to dress; we want to know the probability of precipitation. We do not rely on blood pressure alone to judge a person’s health; doctors use an array of data to make assessments.
The share of earnings or employment within the county tells us how important a sector is to that economy. It is a measure of internal relevance. The location quotient compares that measure to other places (the state or nation) and is a metric of external relevance. A high internal share and a high LQ tells us that a given sector is locally important and more important than in other places.
In Madison and La Porte counties, farming ranks twenty-first in importance as a percent of earnings, but first in location quotients. We can conclude that farming is not especially important here. In Martin County, federal civilian employment (Crane Naval Surface Warfare Center) ranks first in both categories. Clearly, this is a dominant sector. In eight counties, manufacturing holds the number one position in each measure. In no Indiana county does farming lead as the source of earnings and have the highest LQ. Thus, as seen in Figure 5, we would have to be careful about declaring farming the dominant force in any county, regardless of its LQ.
When two measures are used, some will be confused. Others will appreciate the benefits of binocular vision.
Also in this Issue…
- Business Income Taxes in Indiana: Who Pays?
- Calculating Income Tax Liability (sidebar)
- Indiana’s Tax Restructuring of 2002 (sidebar)
- What Is the Economic Base of This Place?
- Suburbs Diversify: Population Change in Racial and Hispanic Composition
- Diversity by the Numbers: Population Growth by County, April 2000 to July 2003


