Midwest Sees Lower Cost of Living
Indiana Business Reserach Center, Kelley School of Business, Indiana University
Consumer prices have become an object of government policy. Inflation is feared after the experiences we had in the 1970s and 1980s (see Figure 1). In recent years, with low levels of price increases, we have begun to worry about deflation.
Figure 1
Percent Change in Consumer Price Index, 1968 to 2002
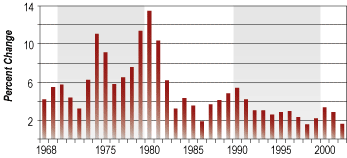
The record of price changes over the past twenty years is not bad. We have not seen a 6 percent annual increase since 1982. The last time we exceeded 4 percent was in 1991.
But price changes vary according to where and how we live. The U.S. Bureau of Labor Statistics gives us little geographic detail about consumer prices. The data produced do not allow us to compare price levels, but they do permit us to compare changes in prices among regions.
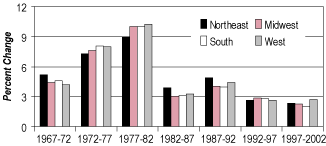
Figure 2 reveals that the Midwest generally has smaller price changes than other regions. Only in the five-year period 1992–97 did the Midwest lead all other regions in its average annual price change.
Figure 2
Price Change by Region: Five-Year Annual Averages
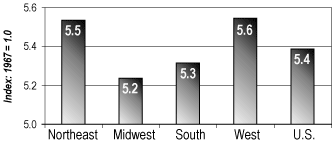
As seen in Figure 3, if a person spent $1.00 in 1967 for the standard basket of goods, that would be equivalent to $5.39 in 2002 nationally. But in the Midwest, a consumer needs to spend only $5.24 to get what was available for $1.00 in 1967—a savings of 2.8 percent compared with the nation. In the Northeast and the West, there was a premium over the national average of 2.8 percent and 3.0 percent, respectively.
Figure 3
Relative Change in Consumer Prices by Region, 1967 to 2002
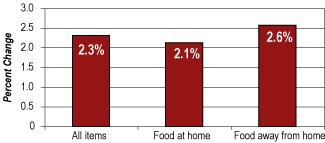
What we choose to buy also influences our personal experiences with inflationary price changes. In the past five years, all items bought by urban consumers have risen by an average annual rate of 2.3 percent. If you eat away from home, your food costs would have risen by 2.6 percent on average, but if you choose to eat at home, those prices would have gone up only 2.1 percent (see Figure 4).
Figure 4
Average Annual Change in Consumer Prices, 1997 to 2002
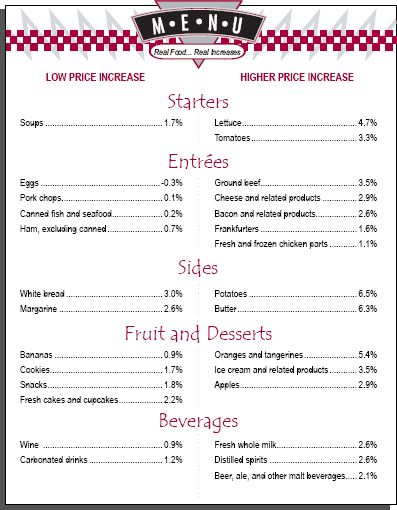
Even what you eat at home makes a difference. Figure 5 offers two different menus based on price changes. Which would you choose? Would you go for the soup over the lettuce and tomato salad? Ham and eggs or the hamburger with bacon and cheese? White bread with margarine or the potato with butter? How about some dessert and a drink? Remember, these are not menu selections based on health or any consideration other than price increases over the past five years.
Figure 5
Average Annual Percent Change in Consumer Prices, 1997 to 2002
The fact is that we make choices about where and how we live. Those choices influence prices and we in turn are influenced in our behaviors.


