Indiana's Population Tops 6.1 Million
Indiana Business Research Center, Kelley School of Business, Indiana University
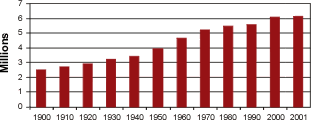
New population estimates issued by the U.S. Census Bureau on December 28, 2001 indicate that Indiana's population increased by 34,000 between April 1, 2000 and July 1, 2001. Since the census count in 2000, Indiana's population continued its climb over 6 million. As of midyear 2001, the Census Bureau estimates the state's population at 6,114,745 (see Figure 1).
Figure 1
Indiana's Total Population by Decade (with July 1, 2001)
The State's Ranking
Indiana ranks 14th among the states in population size, unchanged from its ranking on Census 2000 population. As recently as 1980, Indiana ranked 11th.
Our rank was only 23rd on numeric change and ranked only 31st among 51 states (including the District of Columbia) in percent population change between April 1, 2000 and midyear 2001. With so many other states gaining population faster than Indiana, it's likely that the Hoosier State will slip out of the top 15 by the time of the next census in 2010.
Population Growth Rate
Since the 2000 census, Indiana's population growth has slowed to an average annual rate of 0.4 percent, down from 0.9 percent per year in the 1990s. The national growth rate is considerably higher than Indiana's, both before and after the 2000 census. A slowdown in the rate of population growth is also evident across the United States, but the decline has been more moderate at the national level, from 1.2 percent per year in the 1990s to 1.0 percent since Census 2000 (see Figure 2).
Figure 2
Average Annual Rate of Population Change, Indiana
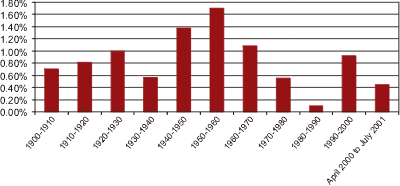
Although Indiana's post-census population growth has slowed, Hoosiers are keeping pace with neighboring states. Michigan and Illinois matched Indiana's average annual growth rate of 0.4 percent since April 1, 2000, but Ohio's population has been anemic, increasing at a rate of only 0.1 percent per year. In contrast, Kentucky has grown by 0.5 percent per year, slightly faster than Indiana.
One might think there isn't much difference between 0.9 and 0.4 percent, so it is helpful to extrapolate from 2000 to 2010 and calculate Indiana's population change under the two alternative growth scenarios. If the current trend reflected by the new Census Bureau estimates persists through 2010, the state's population will increase by 280,000 over the decade. If, however, the more rapid growth witnessed in the 1990s returns, Indiana's population would grow by about 590,000.
Births, Deaths and Migration The Components of Population Change
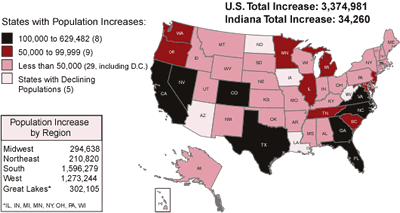
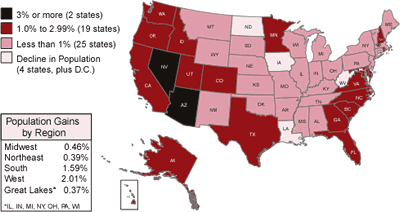
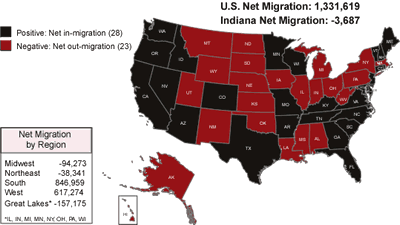
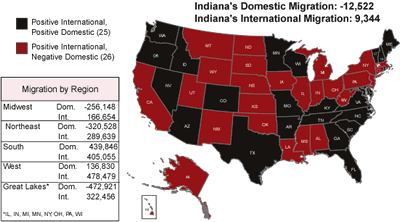
The Census Bureau estimates that persons moving out of Indiana outnumbered those moving in by about 4,000 between April 1, 2000 and July 1, 2001. The net loss due to migration was more than offset by an estimated gain of 38,000 persons through natural increase, the balance of births over deaths. The Census Bureau estimates that Indiana and the other seven states that border the Great Lakes combined to lose over 150,000 residents through migration in the 15 months following the April 1, 2000 census. Among Indiana's neighboring states, only Kentucky was given a positive net migration estimate (see Figures 3, 4, 5 and 6).
Figure 3
Increases in Population: April 1, 2000 to April 1, 2001
Click for Larger Image
Figure 4
Population Change (Percent): April 1, 2000 to April 1, 2001
Click for Larger Image
Figure 5
Net Migration: April 1, 2000 to April 1, 2001
Click for Larger Image
Figure 6
Migration: Domestic and International as of July 1, 2001
Click for Larger Image


